FABRICATION OF A FIBEROPTIC SUPRASTAGE LIGHT SOURCE FOR THE BH2/BHS MICROSCOPE
Direct lighting for microscopic observation is important for subjects which do not transilluminate substage light. This DIY fiberoptic, suprastage, direct illuminator is designed to be low cost, easy to fabricate, install and maintain. The custom fabrication permits use of any of the visible spectrum of LED light sources including white light . This becomes especially useful when the required light source must be of a specific wavelength. In this instance the subject of interest has the property of biofluoresence. Green fluorescent protein (GFP) fluoresces with the application of royal blue light ~460nm. The light source shown here is one designed for provoking dinoflagellates to exhibit bioluminesence. The substage and direct light are matched in wavelength.
PROBLEM STATEMENT:
The microscopic observation of living coral for multiple days requires specific environmental controls that include temperature, light, nutrients, pH control, nitrate and phosphate regulation, and steady salt water flow rate. Additionally videography and stop motion time laps photography require complete lack of vibration and stable ambient temperature. This direct illumination is highly controlled. All heat sources are substantially distant from the microscope and there is no vibration. The direct light source is not attached to the microscope and any movement of the light or the stage does not affect one another.
This illuminator was developed in tandem with a LED for substage illumination. The Knapp BH2/BHS illuminator is described in a previous web posting . The paired illuminators are used for in-vivo bioluminescent studies. A future postings will describe the blocking filtration modification of the microscope.
List of materials;
Fiberoptic cable
Goose neck support
Barbed end plastic tubing connectors
Zip ties
Heat sink
Royal blue (~460nm) LED bulb
Inline resistor
Rosin core solder
Weighted end support
Power supply
Tools:
Soldering iron
Drill bit
Electric drill motor
POWER SOURCE:
Variable Power supply is available for purchase from the Empire of Dirt Workshop (empireofdirtworkshop.com) or contact Carl (carlh6902@gmail.com)
Disclaimer: I did not collaborate with Carl regarding the use of his power source. He makes his own design exclusively for Olympus BH2 microscopes. This illuminator is my design for BH2/BHS Olympus microscopes. I did fabricate a dual outlet extension cord which can be plugged into the LED outlet on the power supply. This allows for simultaneous dual illumination from one power source. The duplex container was fabricated from available PVD parts.
Power supply with Knapp duplex
Fiberoptic cable, end glow, 5mm diameter, 1M length
LED bulbs royal blue ~460nm.
One of two options for resistor choices needed to protect the LED.
Solder the resistor to the positive end of the LED and to the (+) side of the power supply.
Stiff goose neck support modified by zip ties holding a series of plastic hose couplings. The cable was passed through the couplings
The LED is in direct contact with the fiberoptic cable
Heat sink with central hole enlarged by drilling to fit the cables.
Fiberoptic cable press fit end to end with the LED power cable held together by the heat sink.
Completed optical and electronic transmission cable assembly.
The tubing allows the cable end to be advanced or retracted from the specimen.
Completed assembly of the Knapp fiberoptic illuminator. The weight stand is not specific but must be suitable to provide stability.
Custom, closed cell, micro aquarium illuminated by the ~460nm light directed on the surface by the glow end of the fiberoptic cable.
Discussion:
The bulb/resistor assembly could have been compartmentalized to allow quick interchanging with alternative resources however at this time this combined unit is sufficient for the requirements of this project. Resistor may be exchanged to provide different brightness. The LED may be exchanged for different wavelength. I have not tried alternative wavelengths. Ultraviolet wavelengths might be interesting. The one meter length of fiberoptic cable probably could be shortened by 1/2 to reduce light transmission loss. I expect that this device would provide excellent direct illumination for nearly any standard microscope.
Resistor and Power Calculations:
A 5mm oval 460nm (blue) Cree C566E LED typically operates at a forward voltage (V_{f}\) of approximately 3.2V. To run it safely at a standard target current of 20mA (0.02A) from the 6V supply, use the following specifications:
Calculated resistance: (140 Ohm) Uses a standard 150 Ohm resistor.
Resistor Power Dissipation: The resistor will drop 2.8V at 0.02A, dissipating 0.056W. A standard 0.25W (1/4 watt) resistor is sufficient. (Note: While the power supply can deliver up to 2A, the resistor ensures the LED only draws the 20mA it requires). If the 20mA is not bright enough for fast shutter speed photography through the SPLAN 40 (which has a narrower aperture and requires more light), the Cree C566E lamp can tolerate power up to 30mA. To attain the 30mA Formula: Swap the resistor for a (100 Ohm) component. This increases brightness by 50% but will make the LED run slightly warmer. The included LED enclosure design is a small aluminum heatsink.
FABRICATION OF A REPLACEMENT SUBSTAGE LIGHT SOURCE FOR THE BH2/BHS MICROSCOPE
Figure 1. Olympus OEM illuminator housing, bulb, magnifier, diffuser, mounting tube and electrical connector. Not included in image are the transformer, electrical components and controller which are in the base of the microscope
The purpose of this posting is to satisfy the needs of amateur microscopists using Olympus model BH2/BHS with a failing illuminator. It is designed to be low cost, easy to fabricate, install.and maintain.
The BH2/BHS microscope has a substage incandescent light source that is standard with the instrument. The light source required a 120 V power source which is modified by a transformer and microcircuitry built into the base. There are two controllers for this lamp including a on/off power switch and a sliding potentiometer for intensity control.
PROBLEM STATEMENT:
The sliding potentiometer is no longer in production and all online inventory resources for a single replacement this part are out of stock. My Olympus BH2/BHS potentiometer was out of function. Attempts to clean it without disassembly of this substructure were unsuccessful. The other option was to replace the entire light source system with a new low voltage LED bulb.
The housing for the new light source was fabricated from easily available PVC plastic plumbing materials. Other materials listed below were easily purchased from online suppliers.
LIST OF PARTS OF THE ASSEMBLY:
1 !/2 X 2-inch PVC coupling
2″ PVC Pipe Vent Screen, 2.375″ OD, 1/2″ mesh
5/8-inch length of 1-inch PVC plastic pipe
Low voltage DC power cable, 5.5mm X 2.1 male connector ~ 10 inches of ~20 ga twin wire
Round Heat sink, 1 inch outside diameter, 2-inch length with internal space for placing screws
2 machine screws to fit the apertures in the heat sink (your choice)
2-inch disc of sheet ~1mm aluminum, (Secured from scrap packaging)
Aluminum tube 47mm OD X 78mm length
LED star with light frequency of your choice. (I used 460mm for the royal blue).
Thermo-adhesive for attaching LED star to the heatsink
Metallic duct tape to apply to the ID of the microscope substage rear illuminator port
Plastic 0.5mm clear plastic shim stock, (1cm X 15cm strips cut from scrap packaging)
TOOLS NEEDED:
Saw, to cut PVC and aluminum tubing (hand saw or power miter saw)
Scissors, to cut sheet aluminum and plastic
Soldering tool, for micro circuitry with rosin core solder
Thread tap, with sized drill bit for attaching the heat sink to the sheet aluminum mounting plate
Power drill motor
POWER SOURCE:
Variable Power supply available and purchased from the Empire of Dirt Workshop (empireofdirtworkshop.com) or contact Carl (carlh6902@gmail.com)
Disclaimer: I did not collaborate with Carl regarding the use of his power source. He makes his own design exclusively for Olympus BH2 microscopes. This illuminator is my design for BH2/BHS Olympus microscopes.
RESULT:
The new Olympus BH2/BHS microscope illuminator together with the power source provides perfect lighting for Olympus SPlan 5X, 20X, and 40X lenses. The heat generated from the illuminator assembly is minimal. Heat generated from the power source is also well dispersed from the heat sink of the power source.
I constructed three light sources using this method; white light, royal blue and royal blue with a fiberoptic cable for direct illumination. The royal blue light provides illumination to reacts with the green fluorescent protein in the marine organism subjects.
The internal electronics in the base of the microscope are not used but remain to maintain the mass of the instrument thus reducing photographic image blur from extraneous vibrations.
COST:
Not including the transformer and power source, the total cost of parts and materials was less than $50. Including the initial cost of the first unit the cost of three illuminators was less than $75 and I still have excess remaining materials.
Note Not shown here is the fiberoptic illuminator. That deserves its’ own presentation.
ILLUSTRATIONS:
Figure 2 PVC coupling
Figure 3 section of PVC 1-inch pipe
Figure 4 Check of fit of PVC pipe inside of coupling
Figure 5 PVC parts to make illuminator housing
Figure 6 Section of PVC with V shaped split to trap wire
Figure 7 PVC coupling with notch to accommodate wire
Figure 8 PVC Coupling with sheet aluminum and heat sink
Figure 8 Sheet aluminum with holes drilled to receive retaining screws
Figure 10 Electrical components ready to assemble.
Figure 11 LED star glued to heat sink.
Figure 12 Heat sink with wired soldered to LED star, adhered to the heat sink and screwed to the plate ready for assembly into PVC housing.
Figure 13 Heat sink with wire and LED and mounting plate inserted into housing. Some notching was needed to pass the wire through the plate and the side of the interior of the housing
Figure 14 Side view of heat sink with wire and LED and mounting plate inserted into housing.
Figure 15 View of the interior of the larger end of the PVC housing. Note the path of the wire through the notched plate and housing side and retained in the V of the split ring of PVC. Notch in end cap.
Figure 16 The aluminum tube to be used for mounting to the microscope
Figure 17 Full display of parts in the illuminator ready for final assembly.
Figure 18 Rear stack of PVC parts
Figure 19 Wire captured in split ring ready to close with the vented cover.
Figure 20 Fully assembled illuminator. Use sheet plastic shim stock to fill the spaces and make a sturdy assembly.
Figure 21 Interior of the rear illuminator light port modified with parches of 4 layers of aluminum duct tape to make a snug fit for the new illuminator
Figure 22 LED illuminator in place ready for first light.
Figure 23 Completed illuminator replacement kit including transformer, variable power supply, and both the white light source and blue light source.
Figure 24 Power source illuminating both white and blue LEDs
LED lights: White LED Star Cree XLamp B009-CL2075OU3; Blue LED Star Cree XLamp XT-E Royal-Blue A007 E514064
I made two illuminators for specific purposes. The white is for general transillumination. The royal blue is for study of coral polyps with green fluorescent protein bioluminescence. I hope that this keeps all of the Olympus BH2/BHS microscopes working for more years to come.
Just wait until you see the fiberoptic direct illuminator.
Careful observation and accurate reporting are essential for managing land and wildlife and for supporting effective conservation. This presentation proposes a practical tracking approach that could first be tested here in Florida. In much of the African wild, animal locations are currently identified using spotters, trail cameras, drones with cameras, and GPS collars. While these methods are valuable, they are also limited—they are expensive, labor‑intensive, and often incomplete. Data can be distorted by under‑ or over‑counting, double counting, darkness, vegetation cover, distance, or deliberate evasion by animals. Current methods also tend to record animals in isolation, without showing how specific individuals interact with one another or with nearby environmental conditions. This presentation outlines an alternative, complementary approach.
This is part 6/6 in a series of presentations drawing together a thoughtful conclusion from a recent safari to Africa that included parts of Kenya and Tanzania. References and links to the previous posts in this series are listed below.
Across Africa’s protected preserves, safari vehicles crisscross the landscape every day. Each vehicle carries tourists and typically two staff members: a driver and a guide. These professionals are highly trained and experienced spotters, able to identify a wide variety of species at a distance and in challenging conditions. They know their local areas intimately and, after years in the field, are often deeply familiar with the habits, territories, and seasonal movements of the animals they see.
Nearly 80 cars lined up to see a pride of 10 lions. This sort of behavior results in hours of traffic jams and interference with wildlife.
Typical safari car with driver/guide and 6 to 8 guests observing sleeping lions
PROBLEM STATEMENT:
There are insufficient field data on African cheetah.1 At the same time, tourism activities create a powerful, largely untapped opportunity. Could the guide/driver teams already in the field provide real‑time information that can be collected and used to estimate species population counts, locations, and times of observation? This presentation offers a proposal for further investigation using scientific method and tools provided by current technology and AI.
The core responsibility of the driver/guide team is to bring tourists to places where wildlife is most likely to be seen. They drive specific routes at predictable times, often starting before sunrise and ending at or after sunset, covering large areas and multiple habitats over the course of a day.
The drivers and guides routinely communicate with one another to share the location, species, and approximate numbers of animals they are observing. They may also describe size or age class and mention nearby species in the same area. These conversations occur over two‑way radios using public broadcast wavelengths within a defined range. Drivers and guides may speak in a number of local languages, but often include English. The result is a continuous, real‑time stream of observations across a network of safari vehicles operating in the same region. Since these communications occur on citizen band radio, they can be received by anyone tuned to the same frequencies. This shared audio stream could be collected and selectively recorded whenever key observational phrases are used. Those key phrases could then be translated into a common base language and digitized. With each broadcast time‑stamped, the extracted data could be linked to other information such as location, weather, hydrology, vegetation cover, aridification, human population density, land use, disease, migration patterns, and availability of forage. The resulting dataset could then be examined statistically to describe the real‑time status of observed animals and plants across the full area of radio reception. Accuracy and usefulness of this method could be evaluated by comparison with existing monitoring approaches.
Null hypothesis:
The collection and analysis of information from the existing telecommunication network is less accurate and less detailed than the sum of existing wildlife monitoring methods.
Method:
Securing the cooperation of drivers and guides in the field is essential to this project. It is in their long‑term interest to support a comprehensive system that helps sustain the wildlife on which their livelihoods depend. In addition to direct observations, there are multiple data sources that must be correlated and cross‑referenced. As critical observers, each participating driver/guide would be identified by call sign, GPS location, and radio frequency. Training for observers should be simple and standardized. It could be delivered via a short YouTube video and an accompanying qualifying test. This process would also help the LLM (Large Language Model) become familiar with the voices and phrasing of participating speakers. All participants should be uniquely identified to support later quality‑assurance and compliance checks.
The resources that could be converted into usable numeric data include:
Digitally record radio communications on specified CB radio frequencies used by the drivers and guides.
Select key phrases used by the drivers and guides as they communicate across reserve areas. These key phrases may occur in many local languages, so the audio recordings must be translated into a common language, probably English. Anticipate a possible spectrum of up to 30 languages. Each language will need a numeric representation, either directly or through an equivalent English interpretation.
From the recordings, extract and assemble the selected key phrases that describe or identify animals and plants, including variations in identification, counts, and notable behaviors.
Automatically attach to each observation the radio signal time stamp, GPS location, observer identity, meteorological data, and basic descriptors of terrain and vegetation cover.
The method should be tested progressively. Begin with a small pilot group of about 10 participating observers. If early findings are promising, refine the protocol to improve data quality and repeat. Once the method performs reliably according to the revision plan, expand the observer population. Start with English for language interpretation, then add additional languages in order of their frequency of use. Coordinate expansion of observer participation with development of the LLM. Throughout, compare information collected from these broadcasts with results from existing monitoring methods.
Here is a sample outline of the information to be collected and integrated.
Obsrv#
Guide
GPS
Time
Teroir
Cover
Geography
Meterology
Life form
Common name
Count
Behavior
Maturation
Unik Mark
Typical data entry design. Each cell would generate a drop down specific list. Cells can be added or expanded.
Satellite telemetry location data would be matched to each broadcast GPS coordinate. Multiple environmental factors that influence animal behavior could then be associated with each observation. These include time of day, current weather, geography, vegetation cover, relative hydration/relative humidity, barometric pressure, wind conditions, short‑term weather forecasts, moon phase, fires, and human activities such as migration, construction, or land conversion.
LLM training: AI partner in data conversion
Use an Artificial Intelligence, Large Language Model (AI)(LLM) to review the recorded conversations, identify key observational phrases, and perform language conversion into the chosen common base language.
Not all drivers and guides may wish to participate, for reasons that could include:
Information may be pirated and used for illegal poaching. This may already be occurring.
Information could concentrate too many trackers in one location, potentially disrupting normal animal behavior. This effect is already seen in some popular viewing areas.
Important information may be omitted, reducing the validity and completeness of observations.
Drivers/guides may decline to track animals due to dangerous human behavior, poor road conditions, business season, or adverse weather.
Seasonal patterns in tourism may reduce the amount of tracking information available because there are fewer observers in the field.
Guides and drivers may not be consistently employed from year to year, affecting continuity of observations.
Materials and Data Storage:
Contract with a reliable data‑storage service provider. Storage is required both for the audio recordings and for the structured information in the database.
Radio communication over large areas may require long‑distance signal transmission or repeater stations to relay calls to a central recording site. To manage error, there must be a probabilistic approach to ruling out duplicate identification of the same animal. Over‑ or under‑counting can occur when multiple observers report similar animals in the same group. This possibility must be actively addressed. Two main options exist to reduce the chance of counting the same individual twice.
There are several opportunities to reduce overcounting. Skilled observers can describe distinctive markings, injuries, or behaviors that distinguish individuals, even within the same species. Statistically, it is highly improbable for two truly identical animals to occupy exactly the same territory at the same time, so spatial and temporal information can help separate records. Movement patterns for groups of the same species migrating across a defined territory during a marked period can also be modeled. Finally, this method should be embedded within a broader multi‑observer framework that may include aerial surveys or sample‑based density estimates (count per unit area).
Statistics:
A trained biostatistician will be a critical member of the team, responsible for designing the database, overseeing data collection, facilitating analysis, comparing results between and among datasets, and managing corrections for technical errors. This role also includes correlating field observations with satellite information on ground cover and with weather data for aridity, temperature, cloud cover, atmospheric pressure, fronts, and fire events.
The observation period should extend for at least three consecutive years, long enough to encompass maturation of at least one generation of cheetahs. Real‑time data assessment over this period may reveal progressive changes in the populations of cheetahs and of correlated species. Potential keystone species may emerge from these patterns and could then be investigated in greater depth.
Compare data from this method with other monitoring approaches and with historical records. Paired comparison with current data will allow formal testing of the null hypothesis.
Results:
Direct benefit: As with all field methods, this approach has limitations. Darkness, severe weather, and natural disasters affect these observations just as they do existing techniques. Seasons with reduced tourism will naturally yield fewer observations and may skew results. However, when used alongside traditional methods, this approach could substantially augment current data. Scarce resources for difficult fieldwork could then be targeted more efficiently, guided by patterns revealed through this integrated system.
Added benefits: Instead of tracking only cheetah populations, this system would capture data on all species observed by participating drivers and guides. That greatly expands the value of the project by documenting the density, location, and interactions of many species across the landscape. Over time, the data could reveal competition, mutualism, parasitic relationships, and saprophytic behaviors among species.
NEXT STEP:
Here in SW Florida, a trial program could be launched using a readily visible species such as the Osprey. The same basic steps could be followed with a small team of volunteer observers on organized spotting outings. Several locations could be included, with cell phones used to record and store observations. This is an opportunity for you to become citizen scientists and directly support ongoing research. By testing and refining the method in this pilot study, we could then submit a proven approach to existing research programs in Africa.
While well‑visited protected national parks and managed fenced reserves have highly detailed data, roughly 77% of Africa’s estimated 7,100 wild cheetahs live outside protected areas on private, commercial, or communal lands. Because cheetahs are naturally elusive, range over massive territories (up to 1,500 km²), and exist at very low densities, gathering empirical field data on these “free‑roaming” populations is incredibly difficult and has historically relied heavily on informed guesswork.
Don’t forget to like us!
Loading…
If you wish to receive notifications of new postings, please enter your email address and click on subscribe.
If you want to make a comment, please use the comment box.
The purpose of this presentation is to show that there could be other forces driving evolution. I have chosen SE Africa because of its important place in the origin of many species including hominoids. This is an alternative view of vertebrate adaptability in SE Africa during the last 20,000 yrs. It considers relative humidity, animal adaptability and migration. This is a six-part analysis of conditions, supported by data, examples and projections of further changes in populations in SE Africa. This should demonstrate that an outside force is driving animal behavior which results in physical and behavioral adaptation and the origin of new species.
Origin of the Species should be revised. This approach was politically and socially motivated. It does not consider alternative views. It postulates that animals and plants genetically adapt to attain an optimum of performance. It implies that there is a narrowing of focus through differentiation that is progressively better. It presumes the philosophical question of a decision tree with an apex. I believe that this view presents a bias of thinking pervasive in the Victorian era.
Although it is implied, there is no proof of progressive improvement in the Darwinian model. Further as we degrade the environment the apex creatures may in fact be the first to go extinct. Depending on your point of view, does increased specialization imply improvement or loss of adaptive capacity? In fact does life and specialization run contrary to the laws of thermodynamics? The second law of thermodynamics predicts that disorganization will prevail. Highly organized life forms will fail but adaptable, simpler life will prevail. The apex creature may be the worst.
In this photo the elephant and the safari vehicle are conflicted over passage on a corridor bridge spanning a stream in Tanzania. This is analogous to the resource conflict between humans and the wilderness of the planet.
See the previous posts on these links that led to this site: 1234
PROBLEM STATEMENT:
The Theory of Evolution, proposed by Darwin and Russel, is not sufficiently comprehensive to describe the evolving species of mammals in SE Africa during the period of time starting 20,000 years ago until today.
PURPOSE:
The purpose of this study is to find a challenger to the Darwinian theory. I propose the “Theory of Specialization Extinction”. Understanding this concept should guide plans for research and remedy if that is desirable.
HYPOTHESIS:
There is a relationship of four factors that seem to be the driving forces of evolution which differs from the variables proposed by Darwin: time, animal adaptability, humidity and migration. This is the foundation to the Theory of Specialization Extinction
METHOD:
Assemble a database, query it, and interpret the outcomes. The relationships were plotted in a series of graphs where X axis is time, y axis is animal adaptability, z axis is relative humidity graph. The time line is the past 20,000 years. The location is in SE Africa. Use existing data gleaned from multiple Google searches and derive PYTHON software to plot the relationships.
The following graphics are the results of a 3D plot of the variables in a X,Y,Z cartesian coordinate graph. Accompanying this are 2D images for simplified viewing. On the page left side is the graphic. On the page right side is a summary interpretation of the plots on the graph. Where adaptability is the biological versatility and survival threshold of the regional fauna.
Humidity and animal ADAPTABILITY
From Knapp
Graph Variables & Dimensions
X-Axis (Time): Spans from \(20,000\) years ago (Last Glacial Maximum) to the present day.
Y-Axis (Animal Adaptability): Represents the biological versatility and survival threshold of the regional fauna.
Z-Axis (Relative Humidity / Moisture): Represents the effective regional moisture, tracking the African Humid Period (approx. \(15,000\) to \(5,000\) years ago) and the subsequent Holocene aridification. [1, 2, 3, 4]
Fig. 1 A 3D graph plotting time (X), animal adaptability (Y), and relative humidity (Z) for SE Africa shows an inverse correlation.
Deep Purple & Blue (The Past / 20k YBP): These colors represent the earliest part of the timeline, capturing the cold, dry conditions of the Last Glacial Maximum (LGM) [1]. Vertebrate adaptability scores start here. Vibrant Magenta & Pink (The Climate Pivot / 15k to 5k YBP): This transition color highlights the shift into the African Humid Period [1]. It shows where relative humidity spiked dramatically, expanding habitats and ecosystems [1]. Bright Yellow & Gold (The Modern Era / Present Day): This final color marks the end of the timeline (the present day) [1]. It visualizes the end result of centuries of aridification, where vertebrate adaptability reaches its modern peak due to evolutionary pressures [1].
Key trends shown in the plot include
The Humidity Spike (Z-Axis): You will see a clear, high-amplitude “hump” between 15k and 5k YBP. This represents the African Humid Period when mega-lakes expanded across Southern and Eastern Africa.
The Adaptability March (Y-Axis): The trend line creeps steadily upward as time advances. Environmental volatility forces a transition away from specialized, delicate ecological niches. This shifts the ecosystem composition toward hyper-adaptable, generalist vertebrate species (e.g., highly mobile bovids, resilient apex predators).
The 20,000-Year Timeline
20,000 to 15,000 Years Ago (Last Glacial Maximum):
Z (Humidity): Low. The climate was cool and highly arid caused by glaciation
Y (Adaptability): Low to Moderate. Only highly resilient generalist species (versatile feeders and water-independent grazers) persisted in the harsh, patchy grassland habitats. [1, 2, 3]
15,000 to 5,000 Years Ago (African Humid Period):
Z (Humidity): High. Monsoon rains expanded into the southern tropics, creating vast, resource-rich savannas and lakes (such as those in the Lake Malawi basin).
Y (Adaptability): High. The lush, stable environment allowed for an expansion of both generalist and highly specialized animal species. [1, 2, 3, 4, 5]
5,000 Years Ago to Present Day (Progressive Acidification): Caused by increased heat. Not by glaciation.
Z (Humidity): Decreasing. Regional humidity dropped significantly, causing a return to arid or semi-arid conditions.
Y (Adaptability): Bifurcating. Highly specialized taxa (niche foragers) faced extinction, while the surviving fauna demonstrated exceptional, evolutionarily “winnowed” adaptability. [1, 2]. Cats loose. Hyena win.
Fig 2. is a view of the 3D graph showing only the X,Y plane.
Fig. 2 This is a flatten view of the 3D plot to completely ignore the Z-axis (Relative Humidity). This top-down orthographic perspective maps Timeline (X) directly against Vertebrate Adaptability (Y).
Biological Insights from the XY Projection
The LGM Bottleneck (20k to 15k YBP): Adaptability scores start low and flat. The harsh, stable aridity of the Last Glacial Maximum kept ecosystems restricted, maintaining low baseline versatility among surviving specialists.
The Climate Oscillation (15k to 5k YBP): The curve experiences a downward dip and volatility during the African Humid Period. The sudden abundance of water and lush vegetation temporarily reduced the evolutionary pressure to remain hyper-adaptable, allowing niche, specialized species to briefly flourish.
The Modern Filter (5k YBP to Present): As the region dried rapidly, specialized niches vanished. The dramatic upward spike in the index toward the Present shows the evolutionary winnowing effect, where only highly resilient, generalist lineages successfully advanced to the modern era.
Figures 3 and 4 provide similar views of the same information Fig. 3 removes the time variable.
Fig. 3 Viewing the YZ plane removes the time variable (X-axis) from the visual layout, plotting Vertebrate Adaptability (Y) directly against Relative Humidity (Z). Because time is hidden, the chronological flow loops backward and forward across the canvas. The data points remain colored from purple (past) to yellow (present) to help you trace the historical direction.
Biological Insights from the YZ Projection
The Bottom-Left Start (Deep Purple): Represents the cool, dry Last Glacial Maximum (low humidity, low-to-moderate adaptability baseline).
The Upward Loop (Pink/Magenta): Tracks the onset of the African Humid Period. Humidity shoots up toward \(80\%\), creating highly stable, lush conditions. Notice how the line hooks slightly downward or stays stable in adaptability here—this shows environmental abundance temporarily lifting the pressure to remain universally adaptable, giving specialized vertebrates room to diversify.
The Modern Filter (Yellow/Gold): Tracks the crash in relative humidity back toward \(40\%\). As moisture vanishes, the trajectory lunges violently to the right, concentrating heavily at the highest adaptability index values. This isolates the modern faunal profile: a community dominated by highly versatile generalists surviving in an arid landscape.
Visual and Environmental Mechanics
The X-Axis Compression: Notice how the bounding box collapses into a 2D wall. The timeline depth is now indicated purely by the shift from dark purple dots to yellow dots.
The Loop Shape: This visualization isolates the environmental cycle. The curve shows that while humidity fluctuated drastically over thousands of years (moving up and down the vertical scale), vertebrate adaptability was forced into a massive net migration rightward across the horizontal axis due to long-term aridification.
Fig. 4 is an orthographic view showing compression of the data .
Humidity and migration
Here is evidence of relative humidity directly influencing mass migration intensity
Fig . 5 The primary drivers of vertebrate mass migrations are climate transitions. By plotting Relative Humidity and Mass Migration Intensity on a shared time axis, we can clearly observe how severe climate changes trigger ecological shifts.
Eco-Historical Analysis
The Green Corridor Expansion (~14,000 YBP): As the African Humid Period began, a minor migration spike occurred. Large herbivores and their predators migrated northward and inward, tracking the rapid expansion of savannas and wetlands.
The Humid Equilibrium (~13,000 to 6,000 YBP): During this period, migration rates remained low. Highly reliable water sources in Southeast African river basins (like the Zambezi and Limpopo systems) allowed animal populations to establish stable, local ranges.
The Great Aridification Push (~5,000 YBP): This period shows a sharp spike in mass migration. As water holes dried up, massive herds of large mammals were forced to migrate long distances to find permanent water sources. This intense environmental pressure acted as an evolutionary filter, favoring highly adaptable generalist species.
Fig. 6 To visualize four dimensions simultaneously—Timeline (X), Vertebrate Adaptability (Y), Relative Humidity (Z), and Mass Migration Intensity—we can plot a 3D trajectory path where the thickness of the line dynamically changes to represent migration surges.
Interpreting the 4D Synergies
The Humid Period Buffer (15k to 5k YBP): As the trajectory climbs along the vertical Z-axis (Humidity), the line stays thin and adaptability dips. High moisture reduced the pressure to adapt, allowing specialists to settle locally without needing to migrate.
The Late-Holocene Collapse (~5k YBP): As humidity collapses down the vertical axis, the line thickens significantly. This thick segment represents massive migration pulses driven by resource scarcity.
The Evolutionary End State (Present Day): The path ends at the far right of the chart (highest adaptability index) in bright yellow. This illustrates how climate-driven migrations permanently altered the ecosystem, leaving behind a resilient, highly adaptable faunal population.
Figure 7 may be easier to comprehend.
Fig. 7 This is a 2D multi-panel dashboard plot designed to view all four environmental and biological variables side-by-side. Below the plot, you will find the specific fossil records and archaeological evidence from SE Africa that validate the modeled migration spikes.
Archaeological and Fossil Evidence in Southeast Africa
The migration spikes and adaptability transitions modeled in the dashboard mirror real-world paleontology and archaeology findings across Southeast Africa (encompassing Mozambique, Malawi, Zimbabwe, and eastern South Africa).
Archaeological and Fossil Evidence of animal activity reflecting adaptability in SE Africa
The term pulse implies large movement of the animals along low barrier corridors in response to climate shift. The animals follow the water.
1. Pulse 1 Evidence (~14,000 YBP – The Open Savannah Expansion)
Fossil Records (Bovid Turnover): Fossil assemblages from sites like Wonderwerk Cave and Shongweni show a dramatic turnover in mammalian fauna at the end of the Last Glacial Maximum (LGM). As the climate shifted toward the African Humid Period, dry-grassland specialists (like the extinct giant equine Equus capensis) vanished or migrated out, replaced rapidly by water-dependent, browsing, and mixed-feeding bovids.
Archaeological Evidence (Tool-kit Transitions): Human populations tracked these shifting game migrations. Archaeological layers from the transition to the Robberg and Oakhurst technocomplexes reveal a sudden change in hunting equipment. Large stone segments used for hunting open-plains migratory herds gave way to smaller, diverse tools optimized for trapping and hunting non-migratory bush-dwelling animals as woodlands expanded.
2. The Humid Period Stabilization (~15,000 to 5,000 YBP)
Lake Malawi Sediment Cores: Core samples from Lake Malawi show high lake levels and dense surrounding forest cover during this window. Fossil pollen and micro-faunal remains confirm stable, localized populations. Animals did not need to undergo high-intensity, desperate mass migrations because resource baselines were rich and stationary.
3. Pulse 2 Evidence (~5,000 YBP – The Great Aridification Filter)
The Refugia Bottleneck: As SE Africa rapidly dried out around 5,000 years ago, animals migrated en masse toward permanent water networks—specifically the Limpopo and Zambezi River basins. Fossil bone beds in these valley zones show dense, hyper-concentrated mixtures of diverse animal remains from this era, confirming they served as environmental “refugia” where species huddled to survive.
Extinction and the Generalist Winnowing: Niche-dependent, specialized megafauna suffered severe localized extinctions. The fossil layers moving into the Late Holocene show a stark homogenization: specialized grazing species are missing, leaving behind the exact highly adaptable, generalist survivors we see today (e.g., impalas, kudus, spotted hyenas).
Human Forager Disruption: Archaeological sites across Zimbabwe and Mozambique document a matching disruption in human behavior. The Wilton culture hunter-gatherers abandoned many open inland sites completely around 5,000–4,000 YBP, tracking the migrating game lines to settle permanently along coastal zones or river valleys where permanent water persisted.
In the coming decades, animal migrations in East Africa will move along a specific north-south coastal ribbonof land. This corridor is bordered by the Indian Ocean to the east and the “Great Mountain Wall” to the west—a rugged barrier formed by the eastern branch of the East African Rift, including the Southern Highlands, the Eastern Arc Mountains, and Mount Kilimanjaro.
As climate shifts alter regional moisture, wildlife will rely on this coastal strip for survival. They will follow this route:
               [ NORTHERN TERMINUS: Horn of Africa / Somalia ]
                                  ▲      │
                                  │      │
     THE GREAT                    │      ▼
   MOUNTAIN WALL         [ EQUATORIAL ECOTONE: Tana & Galana Basins ]
 (Rift Escarpments,               ▲      │
  Eastern Arc Mts,                │      ▼
 Kilimanjaro, Kenya              [ INTERMEDIATE SAVANNA: Tsavo-Mkomazi Corridor ]
   Dome Uplands)                  ▲      │
                                  │      ▼
                         [ MARITIME REFUGE: Rufiji & Ruvuma River Systems ]
                                  ▲      │
                                  │      ▼
               [ SOUTHERN TERMINUS: Greater Limpopo / Gorongosa ]
This graphic shows the three corridors. The Ruvuma is not physically interconnected to the others. The animals circle about but there is no place for escape.
These three routs will provide key bidirectional corridors which will be followed as the climate shifts. These will allow limited local migration. There is no longer an escape from SE Africa as aridification intensifies and desertification becomes irreversible.
1. The Ruvuma-Rufiji Maritime Fluvial Conduit
Geography: Connects northern Mozambique (Gorongosa and Niassa) across the Ruvuma River into southern Tanzania (Selous/Nyerere Ecosystem).
Northward Pulse (Wet-Season Dispersal): Driven by expanding summer monsoons, water-dependent megafauna (elephants, buffaloes) will push north along the coastal plains.
Southward Pulse (Dry-Season Retreat): As interior grasslands dry up, wildlife will move south, tracking reliable water in the permanent Ruvuma and Rufiji river networks.
2. The Mkomazi-Tsavo Arid-Savanna Link
Geography: Straddles the Tanzania-Kenya border, running squeezed between the Usambara Mountains and the ocean.
Northward Pulse (Xeric Colonization): Highly adaptable, drought-tolerant species (oryx, gerenuk, lesser kudu) will push north into Tsavo as it becomes more arid.
Southward Pulse (Rift-Fringe Buffer): Zebra and wildebeest populations will move south toward the wetter mountain foothills when coastal plains dry out.
3. The Tana-Galana Equatorial Ecotone
Geography: Runs through eastern Kenya up to the Somali border, acting as a critical buffer zone just east of the Kenyan Highlands.
Northward Pulse (Opportunistic Browsing): Giraffes and resilient browsers will move north during brief, intense rainfall spikes.
Southward Pulse (Hyper-Arid Push): Extreme droughts in the Horn of Africa will force northern species to migrate south toward the permanent Tana River basin for survival.
This is a Species-Specific Survival Outlook indicating COMPARATIVE survival (2026–2100)
Based on the presentation of this and the last four postings this is my projection for the next 75 years. Table 1 is the migration behavior timeline correlated to climate benchmarks
Micro drivers of adaptability
Climate Era
Projected Timeframe
Principal Climate Driver
Expected Migration Dynamics
Short-Term Baseline
2026 – 2040
Increased frequency of Indian Ocean Dipole (IOD) anomalies.
Highly erratic, localized pulses. Erratic weather triggers unseasonal migrations between protected parks. Wildlife increasingly relies on community-managed conservancies outside park boundaries.
Mid-Century Shift
2041 – 2070
Aridification of the interior; expansion of coastal savannas.
Consolidated north-south corridors. Large-scale migrations lock into a north-south pattern along the coast. Favorable eco-zones contract, squeezing animals between human infrastructure and the mountains.
Long-Term Equilibrium
2071 – 2100+
Permanent hyper-aridity in the Horn; the coastal savanna shifts inland.
Systemic bidirectional loops. Long-distance migrations become highly synchronized. Resilient, generalist species dominate these routes, while specialized species are limited to small mountain refuges.
To assess how these vital coastal corridors will function through the end of the century, we must look at how future infrastructure blockades collide with the survival traits of specific indicator large mammals. Squeezed between the Indian Ocean and the Great Mountain Wall, wildlife will face unprecedented structural bottlenecks.
Some animals will be restricted because of these three major east-west transport corridors which run completely perpendicular to the north-south migration routes. They will act as physical barriers to those species which cannot physically overcome the obstacles of topography, traffic, fences and human presence. They are listed here [1, 2]:
  [ NORTHERN TERMINUS: Horn of Africa / Somalia ]
       │
       ▼
  [====== LAPSSET Corridor (Lamu-Port-South Sudan-Ethiopia Highway/Rail) ======]
       │
       ▼
  [====== Northern Corridor (Mombasa-Nairobi SGR Railway / A109 Highway) ======]
       │
       ▼
  [====== Central Corridor (Dar es Salaam-Morogoro-Dodoma Standard Gauge Rail) =]
       │
       ▼
  [ SOUTHERN TERMINUS: Greater Limpopo / Gorongosa Ecosystem ]
These are some of the problematic causal locations and issues:
The Central Corridor (Tanzania): The newly operational Dar es Salaam–Morogoro–Dodoma Standard Gauge Railway (SGR) [3] cuts directly across the northern exit of the Selous/Nyerere ecosystem. Its fencing and elevated tracks force elephants and buffaloes into narrow, artificial underpasses.
The Northern Corridor (Kenya): The Mombasa–Nairobi SGR [4] and parallel A109 highway sever the Tsavo East and Tsavo West ecosystems. While some elevated viaducts exist, increased traffic makes crossing dangerous for large herds.
The LAPSSET Corridor (Northern Kenya): This mega-project cuts straight across the Tana River basin up to Lamu [5]. It creates a final, major barrier for animals attempting to migrate between Kenya and Somalia.
Depending on their skill set, groups of different species will handle these infrastructure barriers and climate shifts in very different ways. Here are groups 1. Generalists and 2 Specialists.
Flow diagram. Group 1: The diverse, adaptable skill set group. Group 2. The generalists (High Survival Probability)
Group 1:
African Bush Elephant (Loxodonta africana):
Traits: High cognitive mapping, long-distance memory, and sheer physical power.
Outlook: Elephants are highly adaptable. They learn to actively navigate infrastructure by locating underpasses or breaking through weak fencing when necessary. They will easily use the Ruvuma-Rufiji conduit to track water resources.
Spotted Hyena (Crocuta crocuta):
Traits: Extremely diverse diet, nocturnal flexibility, and comfortable around human landscapes.
Outlook: Hyenas can move easily through fragmented zones. They will use drainage culverts and road shoulders to cross highways, thriving along the corridors by scavenging on roadkill and livestock.
Group 2: The Stranded Specialists (High Extinction Risk)
Blue Wildebeest (Connochaetes taurinus):
Traits: Rely on open, unfenced pathways to track seasonal rains.
Outlook: Wildebeest are highly vulnerable to fencing. Unlike elephants, they will not challenge a fence line and lack the agility to leap over barriers. The Tsavo-Mkomazi link will likely see localized wildebeest collapses as linear infrastructure seals off their routes.
Traits: Limited agility; anatomically incapable of using standard railway underpasses or low viaducts.
Outlook: Giraffes are easily trapped by fences and overpasses. The LAPSSET and Northern corridors risk completely splitting northern giraffe populations from southern ones, leading to isolated, vulnerable genetic pockets.
The Four Macro-Drivers of Adaptabilitythat parallel humidity for causality
While relative humidity directly dictates water availability and respiratory comfort, it operates alongside three other major catalysts for adaptation. I believe that there are several macro-environmental drivers that influence animal adaptability similarly to or even greater than relative humidity. In the table below you see how four core forces compare. Relative humidity is at the bottom. These factors drive evolutionary changes and animal movements east of the great mountain wall. This study shows that at least one outside force could also be driving evolution. There may be other forces but as a working hypothesis these four deserve further research. I picked relative humidity for this discussion because it was the most evident while we were traveling.
Evolutionary Driver
Influence Level
Primary Biological Mechanism
Real-World Impact in East/Southeast Africa
1. Net Primary Productivity (NPP)
Greater
Food web energy, caloric baseline, and vegetation structure.
Dictates the exact carrying capacity of savannahs. When NPP drops, large grazers face immediate starvation.
2. Ambient Temperature Dynamics
Equal
Metabolic rates, thermal stress boundaries, and water-loss velocity.
Forces species into higher altitudes or dense shade to prevent dangerous overheating.
3. Landscape Roughness / Topography
Equal
Physical barriers, escape terrain, and microclimate patches.
The Great Mountain Wall protects localized species by trapping moisture, even during regional droughts.
4. Relative Humidity (Baseline)
Reference
Hydration balance, disease transmission, and evaporation rates.
Sets the broad boundaries for wet-forest vs. hyper-arid ecosystems.
Table 2.
The following are details of the evolutionary drivers listed in Table 2
1. Net Primary Productivity (NPP) — This shows why food is more influential than simple moisture
While humidity creates the climate background, Net Primary Productivity (the total amount of edible plant biomass generated by an ecosystem) is the ultimate filter for survival.
The Energy Filter: An animal can survive low humidity, if it has access to moisture-rich roots, succulent leaves, or prey. NPP represents the actual fuel available to the food web.
Adaptability Impact: When NPP drops, it triggers aggressive evolutionary pressure. This pressure favors hyper-adaptable mixed-feeders (like elephants and impalas) that can instantly switch from eating grass to chewing bark and twigs, thus outperforming picky, specialized leaf-eaters.
2. Ambient Temperature Dynamics & Thermal Scaling
Temperature variations often overpower humidity by pushing animals past their absolute physical limits.
Metabolic and Water Costs: As temperatures rise, the amount of water an animal loses through panting or sweating increases exponentially.
Adaptability Impact: High temperatures favor animals with clever cooling traits. This includes physical adaptations like the massive, heat-shedding ears of the elephant, behavioral shifts like becoming completely nocturnal, or physiological tricks like the gemsbok’s ability to let its core body temperature safely spike during the day to save water.
Recall from our first episode of this saga. The physical shape of the land—specifically the Great Mountain Wall—exerts a massive, nearly permanent influence on animal adaptability by creating reliable environmental safety nets.
Microclimate Buffers: Flat plains offer no escape during a drought. In contrast, rugged mountain terrains create a patchwork of different microclimates, offering cooler temperatures and trapped moisture just a short climb away.
Adaptability Impact: Complex landscapes allow less-adaptable, specialized species to survive in isolated mountain pockets (refugia) for thousands of years, completely shielded from the harsh changes happening on the open plains below.
CONCLUSION:
Combining the micro drivers, macro drivers and the transecting human infrastructures, animals will not escape. They will die from lack of water, starvation and over heating. Exquisitely wondrous, specialized species will vanish with no successor species to follow. Should we continue as we have or rewild to a state of 200 years ago or work for a better future?
We have completed the cat comparisons and with this effort shown that the theory of evolution should be subject to review and perhaps modification. The Theory of Specialization Extinction is incomplete without evidence and proof of concept. In order to provide evidence of this concept four things are needed. A well formulated scientific study. A rigorous review of the literature. A more comprehensive data base that includes not only the endangered species but also the support environment in which they live and the resources upon which they depend. A comprehensive plan for future management.
In a future post we will discuss what may be done to track cheetah, lions and all of the other animal species simultaneously. This would tell us where in lie the problems that may be remedied.
I hope that you enjoyed the pictures along the way. Here are pictures if the animals most likely to survive:
The purpose of this fourth in the series of presentations is to examine the possible future scenarios available for the two cats which we have been using as an example. We have been following the geology and climate effects which are the basis for the ecologies for the last 20,000 years. We have used the cheetah and lion species to see the effects of changes in climate, geology on their adaptability behavior. The story of the cats is an analogy for all of the codependent species who parallel the cats and their experience. This includes people.
The cover picture is a balloon high view of the Serengeti plane with no animals to be seen. The Great Migration had passed. This may be the eventual appearance of the planes after the catastrophic loss of the animals. Such an occurrence happened in the Maasai Mara in the 1960s as a result of diseases spread by domestic livestock. It was recovered by aggressive human intervention. It is coming again and when lost it will not be recovered.
Cheetah and to a lesser extent lions have behavior and genetic characteristics. They have:
Social Resilience: As apex, group-living (pride) predators, lions are behaviorally plastic. They can cooperatively hunt a vast array of prey—from small antelopes to massive buffaloes—giving them a broader dietary cushion than cheetahs as ecosystems shift.
The Megafauna Dependency: Lions depend heavily on large herbivore biomass (like wildebeest, zebra, and buffalo). Over the next millennium, as aridification reduces grass quality and water availability, these large migratory herds are projected to contract sharply. A collapse in mega-herbivore populations will trigger severe pride localized die-offs.
The “Fortress Conservation” Reliance: Because free-roaming lions pose a direct threat to human life and livestock, their long-term survival will entirely depend on fenced and intensively managed reserves. They will likely cease to exist as a truly wild, free-ranging ecological force, surviving instead as highly managed “mega-zoo” populations. [1]
•Reached migratory and reproductive stagnation by ending at a dead end of land
•Failed to develop quick adaptation or mutation to survive in new infrastructure
•They are vulnerable to competition and disease
ALTERNATIVES to EXTINCTION
There are various scenarios for the support of cheetah and lions. I can think of at least the following four options. Re-wild Southwest USA. Genetically redesign the cheetah. Capture and preserve these animals in compatible, tourist friendly Africa. Capture to hold in zoos awaiting rerelease to the wild because of technologic change in human behavior. These scenarios are expanded below by scenario listings.
It is possible to aggressively attempt rewilding of Africa which has been subverted to farming and mining. As mentioned above the Maasai Mara was helped by controlling the intermingling and vaccination of livestock thereby preventing occurrence and spread of diseases. There are other areas in the world where this has been done e.g. Spain, and Argentina.
They could be reintroduced in the Southwest Planes of America along with other African ungulates for prey. Cheetah are originally from the planes of North America. Their predators such as lions and hyena are not present, the prong horn antelope would not be a threat. This could be very successful. Return the cheetah to the planes of North America however, this suggestion would be very controversial and politically unlikely,
Fig. 1, This AI generated rewilding illustration looks so natural because it is. Cheetah did live in North America and preyed upon the pronghorn antelope ~100K years ago.Without rewilding Africa will look like this (Much of our last 2024 trip already looked just like this.)
Scenario 2: Gene editing and cloning
The cheetah is an evolutionary specialist built entirely for speed in the daylight. This hyper-specialization makes it incredibly fragile under the pressure of rapid ecological shifts: The following bullet points project their future.
The Nocturnal Trap: Cheetahs are traditionally daytime (diurnal) hunters to avoid nocturnal apex predators like lions and hyenas. However, with rising temperatures in Southeast Africa, cheetahs are forced to shift their activity to cooler twilight and nighttime hours. This behavioral shift places them in direct, fatal contact with lions, leading to higher cub mortality and increased theft of their kills (kleptoparasitism).
Genetic Dead End: Due to ancient and modern population bottlenecks, which was the topic of Part 1 of this series, wild cheetahs suffer from extreme lack of genetic diversity. This results in high percentages of abnormal sperm, low reproductive success, and a highly fragile immune system unable to adapt to novel diseases. [1, 2]
Habitat Fragmentation: Cheetahs require vast open and unfenced home ranges to hunt successfully and evade larger predators. As human development fragments Southeast Africa, cheetahs are pushed out of protected areas into hazardous farmland, accelerating human-wildlife conflict.
To avoid these traps another option might be to genetically create a similar parallel species. With lots of genetic manipulation it might be possible to cross breed the cheetah with American cats like the puma, cougar, or jaguar. This would require extensive genetic CRYSPR manipulation and IVF.
Fig. 2, A cheetah stands alert in its natural savanna environment.
Fig. 3, This is an AI generated Illustration of hybridized Cheetah/Jaguar. I projected heavier build, larger face for stronger biting and a different spot pattern for better camouflage. It appears similar to a leopard. It won’t be as fast as a native but will be more powerful and stealthier.
The Cheetah will not Outrun Climate and Competition
This AI constructed illustration represents the cheetah chased by its foes of climate change and competition. The oversized spotted hyena represent the foes, however, this may actually happen. The hyena, as generalists, are the most populous and successful predators of all of Southeast Africa. They do prey on cat cubs and capture prey from the cheetah and lions.
The Lion: has Formidable Strength but is Trapped by size and caloric needs
Lions possess a greater buffer against change due to their social structures and physical dominance, but their massive resource requirements present a distinct bottleneck: [1]
Social Resilience: As apex, group-living (pride) predators, lions are behaviorally plastic. They can cooperatively hunt a vast array of prey—from small antelopes to massive buffaloes—giving them a broader dietary cushion than cheetahs as ecosystems shift.
The Megafauna Dependency: Lions depend heavily on large herbivore biomass (like wildebeest, zebra, and buffalo). Over the next millennium, as aridification reduces grass quality and water availability, these large migratory herds are projected to contract sharply. A collapse in mega-herbivore populations will trigger severe pride localized die-offs.
The “Fortress Conservation” Reliance: Because free-roaming lions pose a direct threat to human life and livestock, their long-term survival will entirely depend on fenced, intensively managed reserves. They will likely cease to exist as a truly wild, free-ranging ecological force, surviving instead as highly managed “mega-zoo” populations. [1]
Lion finishing off a meal of buffalo. A large male can eats minimally 25 pounds/day, maximally 88 to 100 pounds of meat.
Scenario 3: Capture , Confinement and Preservation
Cheetah in Naples Zoo today. Captured. Not running, hunting, not reproducing. Two lions also in the Naples zoo. They are just about as useful as the cheetah next door.
SURVIVABILITY PROJECTION
The survival potential for both cheetahs and lions over the next 1,000 years is highly compromised, with the cheetah facing a much steeper, more immediate threat of extinction. While both are apex carnivores, their divergent biological traits, hunting strategies, and genetic health mean they will handle the looming desertification and human encroachment in drastically different ways. Table 2. shows the current status of the cheetah and lion.
Here is a projection matrix of the next millennium. It outlines how these variables are expected to interact:
Biological Metric
Cheetah (Acinonyx jubatus)
Lion (Panthera leo)
Current IUCN Status
Vulnerable (Declining rapidly; under 7,000 wild individuals)
Extremely Low (High probability of wild extinction within centuries)
Low to Moderate (Dependent on intensive, fenced human management)
Climate Change Vulnerability
Severe (Thermal stress forces overlapping schedules with larger predators)
Moderate (Droughts impact reproductive cycles and megafauna prey)
Genetic Adaptability
Critically Poor (Extreme inbreeding depression from historical bottlenecks)
Moderate (Fragmented populations but retain higher overall diversity)
Table 2. Today’s Survival Matrix: Cheetah vs. Lion
FUTURE PROJECTIONS
In preparation for rescue considerations and based on current climate models and evolutionary biology, the next 1,000 years in Southeast Africa will be defined by rapid, human-driven climate changes and artificial selection. Extreme weather events will force animals to adapt at an unprecedented pace. Generalists will dominate while specialized species face localized extinctions.
Time (Years from Now)
Relative Humidity (Z-Axis)
Animal Adaptability & Response (Y-Axis)
Environmental Context
0 – 100
Highly Variable / Drop in Soil Moisture
Extreme Stress (Behavioral Shifts)
Rapid global warming. Severe droughts alternate with intense floods. Animals alter migration routes and nocturnal behaviors.
100 – 300
Decreasing / Aridification
High Selection Pressure (Micro-evolution)
Expanding desertification. Small, fast-reproducing generalist species rapidly adapt, while large mammals face steep declines.
300 – 600
Stabilizing at Lower Baseline
Moderate (Homogenized Ecosystems)
New ecological baselines establish. Highly adaptable “weed species” (rodents, certain birds, insects) dominate the landscape.
600 – 1,000
Low to Moderate
High (Stabilized Novel Adaptations)
Long-term evolutionary stabilizing. Surviving fauna exhibit permanent genetic shifts in heat tolerance and water conservation.
Table 1, Time related to relative humidity and animal adaptability. Environmental context supplements extant conditions.
The Outlook
Within the next 100 to 200 years, unmanaged wild cheetahs are predicted to go extinct, leaving only highly inbred, artificially sustained captive or semi-captive populations. Lions will likely persist longer due to their dominance and economic value to ecotourism, but by the year 3000, they will exist purely within heavily fortified, human-engineered ecological islands across Southeast Africa like today’s rhinos.
Portend for Humans
Human genetic diversity is actually quite low compared to many other species. All modern humans stem from a very, very small population that lived perhaps 900K-800K years ago. It is also suggested that another genetic bottleneck was created by the Toba volcanic Super Eruption 75K years ago. Chimpanzees and gorillas actually have greater genetic diversity within their species than humans do.
There are multiple risks to which we have exposed our species. We are nearly twins of one another. With a little planning we can donate blood and with meds even donate organs among one another. Because of our technical skills we are susceptible to pandemics which we can spread rapidly across the globe. This is all too similar to the cheetah.
Here are our alternatives:
We need to increase our management of the planet. We have already made giant strides in terraforming Earth by farming. There are two paths to complete the task. Rewild or reengineer are the real alternatives. We can’t continue to stumble along as we have done in the past. That option has gotten us to our current crisis point. Rewilding may return us back to where we were two hundred years ago. Reengineering can take us to a place where we want to be. What alternatives do you have in mind?
Based on observations made in Africa our next posting, Part 5, will dive deeper into the potential overturn of one of the foundations of biology; Darwin’s Theory of Evolution.
If you wish to be notified of future postings please enter your email and slick on subscribe
If you wish to comment on this posting please use the form
This presentation is the third in a series of blogs that uses the example of Cheetahs and Lions to show the survivability effects of evolving specialization. The first in the series lays the foundation of geography, climate and time. The second compared two African cats; Lions and Cheetahs. This presentation introduces the concept of traps. The “traps” are made of time, location, resources and specializations. They put these cats at risk for survival. Survival of the species depends on behavioral modification, physiologic adaptation and selection by desirable mating. We may have exposed ourselves to the same traps. This is not about mechanical traps. These are more insidious.
In The opening video clip – The “traps in this presentation are UNINTENTIONALLY generated by the animal’s remarkable behavior and adaptations. They are more SIGNIFICANT than physical traps
Traps are the delimiters that block biologic adaptation to a changing environment. Inability to overcome traps leads to extinction. It is not about survival of the fittest. It is about survival of the most adaptable. This is the reason to study the survival of these two cats. Understanding the pitfalls will reflect on the survival of everything, specifically us.
In order to discuss unintentional consequences of behavior leading to traps, I suggest that we review of the work of the naturalists of the 18th century. Several theories had been proposed. The most notable is the Theory of Evolution. Darwin and Wallace proposed the foundational ideas. Survival of the fittest forces the origin of species. Additionally, isolation promotes differentiation. In the view of these observers of nature, there is a progressive change in the survival of the majority. I propose an alternative view of the Darwinian theory. Let’s call this the Theory of Specialized Extinction.
THEORY OF EVOLUTION
I respect the pioneering publication of the books of Charles Darwin. These include The Beagle diary (1839), Origin of the Species (1859) and The Descent of Man, and Selection in Relation to Sex (1871). I first read these 66 years ago when I was in high school. Here are the tenants of his theory. My comments are in italics.
Overproduction: Organisms produce more offspring than their local environment can support, which leads to competition for limited resources. Alternatively, it may lead to cooperation, revolution or migration. Variation: Individuals within a single species naturally display a wide range of variation in their physical traits, behaviors, and genetic makeup. This suggests that there are mutations in the population. Inheritance: Many of these unique variations are heritable—meaning they can be passed down from parents to their offspring. This does not take into consideration dominant and recessive genes. Differential Survival & Reproduction: Individuals possessing traits best adapted to their specific environment (“survival of the fittest”) are more likely to survive threats and successfully reproduce. If individuals are highly specialized they may not be able to adapt to the changing environment. Descent with Modification: Over vast expanses of time, these advantageous traits become more common in the population. Gradually, this accumulation of changes can lead to the emergence of entirely new species. The rate of accumulation of traits depends on the complexity of the organism. The accumulation of traits does not necessarily lead to new species but may lead to species vulnerabilities.
Most of Darwin’s work suggests a time line with a steady progression of change, most of which was deemed to be an improvement. In prospect most of his writing appears to be intrinsically biased. Yes, there is change, however, it is coincidental with “implicit bias”. It does not confirm causality. Additionally, an apex implies that there is a narrowing of differentiation that is progressively better. It presumes the philosophical question of a decision tree which has an apex. It does not imply value to alternative views.
Although it is implied, there is no proof of progressive improvement in the Darwinian model. In fact, as we rapidly degrade the environment the apex creatures may be the first to go extinct. Depending on your point of view, does increased specialization imply improvement or loss of adaptive capacity? In fact does life and specialization run contrary to the laws of thermodynamics. The second law predicts disorganization.
A horizontal continuum for example could be applied to the time line of species differentiation. Here is a visual representation of a relationship between and among animal adaptability and humidity during the recent 20,000-year history of the area. I picked humidity because, as you could see in our previous presentations, desertification was the most prominent aspect of the environments we explored.
X-Axis (Time): Spans from \(20,000\) years ago (Last Glacial Maximum) to the present day. Y-Axis (Animal Adaptability): Represents the biological versatility and survival threshold of the regional fauna. Z-Axis (Relative Humidity / Moisture): Represents the effective regional moisture, tracking the African Humid Period (approx. \(15,000\) to \(5,000\) years ago) and the subsequent Holocene aridification
Please see the extensive discussion of this in the following posting titled Exploring Animal Adaptability in Southeast Africa.
The 20,000-Year Timeline
20,000 to 15,000 Years Ago (Last Glacial Maximum):
Z (Humidity): Low. The climate was cool and highly arid.
Y (Adaptability): Low to Moderate. Only highly resilient generalist species (versatile feeders and water-independent grazers) persisted in the harsh, patchy grassland habitats. [1, 2, 3]
15,000 to 5,000 Years Ago (African Humid Period):
Z (Humidity): High. Monsoon rains expanded into the southern tropics, creating vast, resource-rich savannas and lakes (such as those in the Lake Malawi basin).
Y (Adaptability): High. The lush, stable environment allowed for an expansion of both generalist and highly specialized animal species. [1, 2, 3, 4, 5]
5,000 Years Ago to Present Day (Progressive Aridification):
Z (Humidity): Decreasing. Regional humidity dropped significantly, causing a return to arid or semi-arid conditions.
Y (Adaptability): Bifurcating. Highly specialized taxa (niche foragers) faced extinction, while the surviving fauna demonstrated exceptional, evolutionarily “winnowed” adaptability. [1, 2]
Theory of SPECIALIZED extinction
Specialized Extinction is progressive reduction of life forms. It is the unspecified opposite of Darwin’s theory. Please recall that Darwin’s work of the mid 1800s predated the current concepts of ecology, genetics, statistics, modern scientific method, advances in understanding of natural history, microbiology, plate tectonics, climate change, extraterrestrial incidents, human behavior, etc.
We are experiencing the reverse of the origin of the species. This is the loss of the species variations. Species vary in response to environmental pressure. Without necessity there is no invention. With environmental change only the adaptable will survive.
MASS EXTINCTIONS
During the ice age animals located in water compromised areas or in cold climates faced environmental pressure. Many were not capable of adapting with sufficient rapidity to the changes. The advancing cold wall of ice combined with the massive dust storms which ripped across the deserts of the planes starved, froze or buried millions as they struggled to compete for diminishing food and water. These climatic events resulted in loss of thousands of species, of fauna and flora of the northern continental masses.
This process of extermination was exaggerated by bottleneck effect and genetic drift.
Fig 1
Fig 2
Fig 1 and Fig 2 are two variations on population behavior that limit the genetic pool of diversified genomes.
In Fig. 1 This can happen when the genetic pool is insufficient to maintain variance. The largest constituent group are light and dark green. If the orange portion dies and the purple portion does not invade, then the survivors can only reproduce mixed green progeny.
In Fig. 2 In the biologic bottleneck only a few members of the population escape. In this case the green did not pass the bottleneck. Those that did act are founders of a new community with a more exclusive population. Since only one yellow member passed the bottleneck it represents an extinction effect unless it can hybridize with the blue members. If not it will die thus ending that part of the population. Hybridization may result in a recovery of the population that will not be exclusively blue. Alternatively, with recessive traits the population will recover with a Mendelian result.
The well known traps are outlined below. I suggest that the study of these traps may challenge the initial concepts theorized by Darwin.
TRAPS DEFINED
By specialization animal abilities to avoid these traps are disadvantaged.
Specialization Trap is where the animals of a species undergoes physical evolution to match their environment. This results in highly efficient but physically fragile animals who cannot cope with the changes in their environment that occur faster than they can adapt. This includes many species and may be a natural process. Loss of one non-adapting species makes room for another. This is consistent with Darwinian “Natural Selection”.
Genetic BottleneckTrap results in reduced adaptability. When the population reaches a point of limited genetic variation there is insufficient capacity to adapt to environmental changes, such as climate change or new diseases.
Genetic Drift Trap results in lack of genetic diversity.
Declining Prey BaseTrap is a broad based result of all the regional population of mutually entangled species with an extremely low general DNA variance.
Habitat FragmentationTrap prevents the massive, free-roaming across territories. Without corridors, species cannot migrate to compatible environments. Conversely, species variants can immigrate into territories thereby promoting hybridization.
Daylight Hunting Trap Prevents animals from night hunting while hot, dry daytime conditions become intolerable
Human-Wildlife Conflict. Genocidal hunting, trapping and habitat destruction by farming and mining at industrial scale combine to make the ultimate trap.
CHEETAH
Cheetah are likely a distinct, naturally evolved species (Acinonyx jubatus) belonging to the small-cat lineage (Felinae). Their closest living relatives are the puma (mountain lion) and the jaguarundi. They cannot be naturally hybridized with other members of the Felinea because they are just too different. They split from the rest of the cat family tree millions of years ago and are the sole members of their own unique genus, Acinonyx.
They are not related to the Pantherinae (Lions, which started in Africa)
Cheetah existed secondary to late Pleistocene bottleneck extinctions 100K to 12K years ago.
Cheetahs are believed to have survived the two ice age catastrophic population bottlenecks that nearly drove the species to extinction. [1, 2] The root causes of cheetah’s problems were the two historic climatic bottlenecks plus their great speed. They were able to quickly run ahead of their competitors and ranged widely looking for prey. They out ran their competitors and extended beyond their base population. As small groups continuously separated from their peers they formed new island clusters. These founder effect groups were cut off from hybridization and experienced genetic drift. In summary:
They are not related to the Pantherinae (Lions, which started in Africa)
Cheetah existed secondary to late Pleistocene bottleneck extinctions 100K to 12K years ago.
Cheetah developed in the Asia/Americas and are related to domestic cats.
Extremely inbred with depressed dominant traits.
They are all near identical clones: Completely depleted of variation in their genomes
They are experiencing founder effect. Africa is their CULMINATING POINT
LION
As a member of the big cat family these animals were born and bred in Africa. Modern lions diverged and began to leave its earliest fossilized footprints in East Africa around 2 to 3 million years ago. Through a combination of geographic refugia, extreme dietary flexibility, and evolutionary teamwork the lions thrived in the dry, ice free planes of Africa.
Cheetah and Lion – SUBJECTED TO time, relative humidity and LEVEL of adaptability
Over the last 20,000 years in Southeast Africa, climate shifts drastically altered humidity and ecosystems. The region swung between severe arid phases (like the Last Glacial Maximum) and the highly humid African Humid Period. In that period animal adaptability peaked. Generalist species thrived by adjusting to habitats, while specialists faced selective extinction. [1, 2, 3, 4] Some mammalian species failed to track their preferred climates over the last several thousand years. The failure to either migrate or adapt quickly may be their obstacle to survive. There is a significant time lag between climate change and species’ responses. These two cats were able to survive. The African Saber-toothed Cats, Scimitar Cats, Eastern Koppard and the Giant Cheetahs did not make it through the last 50,000 to 10,000 years.
Below is a four-column table of paleoclimatic and evolutionary timeline outlining the historical shifts:[1, 2]
African Humid Period. Savannas expanded, and water-reliant generalist species thrived and spread.
5,000 – 2,000
Decreasing(Drying Trend)
High (Behavioral Adaptability)
Monsoons weakened, leading to progressive desertification and forcing animals/humans into complex, mixed-habitat strategies.
2,000 – Present
Moderate / Variable
High
Modern climate regimes. Continuous micro-adaptations are documented, though global warming increasingly tests limits.
Table 2. Variables and Environmental Context
This is the scenario of failure to survive, the theory should be called “THE THEORY of SPECIALIZED EXTINCTION” The tenants of this are
Reproduction with wide ranging genetic adaptability
Environmental change
Differential reproduction based on past environments
Extinction by environmental change
THE EFFECTS OF THIS ON PEOPLE TODAY
A very small hominoid population (likely Homo heidelbergensis or Homo erectus) expanded before 900,000-800,000 years ago. It underwent a massive glacial bottleneck which lasted for 100,000 years. The population was reduced to ~1200 individuals. This lengthy event killed off so much of the population that it irreversibly reduced the genetic diversity of the species. The effects of that have persisted until today. Even though chimpanzees and gorillas might look similar to us, they have many more times the genetic diversity within their species than humans.
CONCLUSION:
We can conclude that developing survival strength through unique specialization may be a death trap. To do this we followed cheetahs and lions as they adapt and survived through the last 20,000 years. There was an entire eco system which followed the same path. We should pay more attention to the generalists. Survival by adaptation to environmental change is more advantageous than specialization. Ability to change our environment may be our only survival option.
In our next posting (Exploring Animal Adaptability in Southeast Africa) we will try to project the future of the fauna for the next 50 years. See you there !
If you wish to receive notifications please enter your email address and click on SUBSCRIBE
If you wish to comment on this posting please use the form below>
In this savannah sunset illustration the lion rests calmly. The cheetah dashes across the plane. What is the reason for these differing behaviors? (Find the answers below.)
INTRODUCTION
The purpose of this posting is to show how these two animal species have evolved, adapted and competed in the same environment. Have you seen to previous post in this in the series? Glacer and Plate blog. Cheetah and lions are superficially similar but so different in their behavior and genetics. Their behaviors may have determine their ultimate fates. This is part 2 of a series on adaptation and survival in Southeast Africa. This portends the future of two species of cats. I used these beautiful animals as an analogue to all animals in all environments.
Vocalization ———-4 stages body language & sent trails
Speed —————————–50 kph
Social ————-pride or coalition*
Territory ——————– 1000 sqKm*
The lions and cheetah are planes creatures that feed on migrating animals. Their prey population feeds on grass. Without predictable rain there is no grass. Without water, grass and prey the predators must range widely for hunting or die. The wider their range the more isolated they become.
Here is how the Cheetah compares to the Big Five cats.
Cat
Native region
Ave. Weight
Ave. Speed mph
Ave life span yrs
Lion
Africa and India
420 lbs (male) 280 lbs (female)
50
15-16 (female) 8-10 (male)
Leopard
Africa, Asia, Russia, India
68 lbs (male) 51-60 lbs (female)
36
12-17
Cheetah
Africa, (Iran ?)
46-160
50 – 80
10~12
Jaguar
Americas
120-210
50
12-15
Puma (Cougar)
Americas
120-220 lbs (male) 64-140 lbs (female)
40-50
8-13
Tiger
India (Asia)
200-680 lbs (male) 140-370 lbs (female)
30-40
8-10
Table 2. Specification of large cats
CHEETAH BEHAVIOR
It is not difficult to see the vulnerability of the cheetah. From Table 2, you can see that they are the smallest, shortest lived, and least distributed animals of the group.They are not one of the big cats. Additionally, they are solitary animals with the lowest cub survivability. Cub mortality is high. Up to 90% of cubs do not survive to three months due to predators like lions and hyenas. Do they really belong in Africa?
Sleek proportioned lone cheetah hunting for prey.Lone Cheetah with successful hunt constantly checking for other predators like lions and hyena who may steal the catch. She has no group to help like lions who hunt with the pride. Her keen eyes and great speed would not be an advantage for hunting at night.
Cheetah females reach sexual maturity at 18 to 23 months and breed year-round. Pregnancy lasts approximately 90 days. They birth 3 to 6 cubs in a hidden den.
Very unusual cheetah mother with three nearly full grown cubs lying under a tree in midday sun. With cub mortality rate at 90%, she has been a very successful provider. Soon they will separate leading to solitary lives; meeting occasionally; socializing only for mating.
Their obvious advantage is their speed. This advantage is only useful when there is sufficient space to reach that speed. They are planes creatures that have semi-retractable claws and less flexible ankles. They rarely find use for trees. They are also very quiet animals compared to lions. They lack the specialized larynx required to roar thus limiting their long distance communication.
LION BEHAVIOR
Lions are truly one of the Big Five cats.Their size, distribution and longevity are characteristics that are collectively superior to any of the others. Additionally, they have a very structured social community. They behave as a group when hunting thus improving the survival of the individual. They are polygamous during their estrus period. Gestation is 108 to 110 days producing 1 to 4 cubs. Cub mortality is high (often up to 60-76%). A new lead male cat will kill cubs in the pride from defeated pride leaders. They are planes creatures that are heavy and lack flexibility finding no good use for trees.
Adult male lions rest after consuming their fair share of the hunt provided by the female. These are probably siblings.Young adult lions from various mothers in the pride sitting in the shade waiting until the dominant female to signal for them after a successful hunt. They continue this social behavior throughout life.Lead lioness scouting the hunting territory without help and without her litter to care for.
Vocalization; Roar
Growl, grunt and chuff
Completely ignoring the automobiles around them this lion couple use scent and body language behavior preliminary to mating .WHAT ! This is not the typical lion dehavior. Maybe we should have called the ladder fire-truck to bring him back down.Sleeping is what they do best. Like most cats, they are twilight/nocturnal hunters. Note the social contact even while sleeping.
EFFECTS OF HUMAN BEHAVIOR
After development of farming and increasing population growth, especially during the last two hundred years has dramatically exploded. Humans have established farms on arable land. Water has been diverted to the farms. Fencing and other defense measures have been erected. Native undomesticated animals from the naturally undeveloped land have been blocked from ingress into areas reserved by humans. Animals living in the wilderness are hunted to suppress their population, to be taken as trophies, killed by wars and industrialization and by obstruction of their migrating and hunting corridors. These have divided and isolated them into small unconnected groups.
SPECIES TRAPS
Isolation dilutes the population and requires the smaller groups to develop as “founders” of a new group. The isolated group becomes inbred risking a genetic drift death trap.
CONCLUSION
The behavior of these two cat species is extraordinarily different. Behavior and size differences are the key to their success despite the identical competitive demands. Both use the same territory and face the same weather, habitat and human exposure. Which do you believe is the most successful? Why?
See the next installment in this series to understand the other “traps”.
If you wish to receive notification of new postings please enter your email address and click on subscribe.
If you wish to comment please use the form below
If you wish to participate in a discussion please use the board.
Fig. 3 Ngorongoro Crater in Tanzania, 2025 desertification
Introduction
The terrestrial forces of tectonic plate movement, ice ages and volcanic activity, together have changed the earth like no other forces except collision with extraterrestrial bodies. Southeast Africa has strategically benefited from these earth changing forces. This can be seen in the generation of a widely varied collection of mega and micro fauna and flora like no other place.
Fig. 10 The Ngorongoro 5 years ago.
The introduction picture shows a 7 zebras and 5 wildebeest in the Ngorongoro Crater. We went there using safari vehicles in 8/2025. The only road was made of irregular stones, ruts and dirt. Driving was difficult. Visibility was obscured for hours by dust as we drove across the crater. It is the caldera of the worlds largest above water volcano that was active 2.5 million years ago. It was famous for its wildlife. The image shows the greatest concentration of animals which we encountered along the way. To say that it was disappointing is an understatement. Fig. 10 comes from a posting on the internet.
Changing forces
Today we can see that the forces are changing. Tectonic plate is the slowest acting force acting in the level of hundreds of millions of years. And yet its rate and direction of movement can change dramatically in regions. This may be caused because glaciers and ice shelves are reduced. Glacialization operates at more rapid rate than plate movement with an effective speed measured in thousands of years. As the ice melts the weight of the water is more evenly distributed to the oceans thus altering the plate movement location and location of volcanic activity. Notably, the rate of vulcanism is unchanged. Volcanic ash, carbon dioxide and sulphur and gases are insignificant when compared to human activity. Anthropogenic CO2 emission for 2010 is estimated to be about 80 to 270 times larger than the respective maximum and minimum annual global volcanic CO2 emission. The results of action and reaction of human intervention parallel a cause and effect interference with historic geologic cyclical behavior. This may be the root cause of two possible effects of biological changes which are currently occurring. Survival of existing species is in decline. Generation of new species has slowed. This series of postings uses a contrast of two cat species, lions and cheetahs in Southeast Africa. Study of these species is intended to form a foundation for understanding how the change in the forces drive the current ecological conditions.
These four blogs are the result of thoughts and interpretations based on our latest safari to Africa that included Kenya and Tanzania. This was not a high-end trip. Instead it was a road trip to some of the lesser visited sights and it was during a period that was unexpectedly dry. I was particularly interested in the survivability of two well recognized cat species. The lions and cheetahs are two very different genus of predatory cat species at the apex of the food chain.
Fig 1. A distinction of genus is the outstanding characteristic to be followed in this series. Cheetah are from the genus Acinonyx while Lions are of the genus Panthera. They are not genetically related.
Let’s look at the driving forces and their results. The following charts show the approximate location of the Great Rift Valley region in Southeast Africa. This is a massive geologic event which is actively happening as we watch. The continent is splitting the eastern quarter of the continent off the main body. This gigantic split has created a huge valley that will someday be filled with ocean. It is accompanied by volcanoes, earthquakes, lava flows and uplifting plateaus.
GLACIAL REBOUND
From the last two glacial periods, 21,000 and 13,000 years ago, the continents are still recovering. The ice pack at the poles still hold the last remnants of that ice age. One result of this diminishing ice can be seen in the African desertification. The Sahara and Kalahari deserts are the result of the last ice age. When the poles melt and the Rift Valley floods the main portion of the African continent will recover. The deserts will bloom and the chronic drought in Africa will be concluded. The new continent will be created east of the Rift Valley. Migration may reverse. It just takes time. Never-the-less, the adaptable survivors will prevail.
Fig.2 Olduvai Gorge in Tanzania, the Louis Leakey campsite, desert landscape
ECOLOGIC BARRIERS
As a result of the climatic changes, geographic barriers emerged. These are called Walls and they divide Africa into three eco regions.
These include the Saharan desert, the sub Sahil West-Africa separated from the Sahara by the line called the wall called the Sahil and East-Africa with Great Rift Valley, Fig.4, separated from wast Africa by the Great Wall of mountains.
The Great Walls of Africa limit the direction of animal migration and isolate the wildlife. This isolation has a double effect on all life forms by promoting speciation but also risking the compromises of genetic drift. In Fig. 5 the Sahil, shown as a green line, is the wall created by the Sahara. The Great Wall of mountains shown as blue line of Fig.5 parallels the Great Rift valley. Note that the regions of Kenya and Tanzania, Fig. 6 outlined in blue, are in high arid, desert risk locales.
MIGRATION
Through the two Great Walls there are narrow gaps called “bottle necks” . These geographic locations limit commingling and migration of species. These are the few areas through which animals can migrate. Except for the Nile river flowing through the Great Rift valley none of these areas follow the seasonal north-south wet weather patterns nor a river flow to another land mass. The access to Eurasia from the generative basis of Africa is through the three bottle necks of the Straights of Gibraltar, the Nile river delta and the Straight of Bab Al Mandeb. During the last 12,000 years the shallow Nile river delta crossing has been the least treacherous.
Mov. 1 Wildebeest migrating northward following the water and new grass. Lions, Cheetah and other predators follow the prey.
The illustration Fig. 7 is a conceptualization of the most direct routes for migration. Interestingly the Great Migration for animals from Africa also follows the projected route for hominoid migration. Mov.1.
Fig. 4 Location of the Great Rift Valley shown as the purple area in the red bracket. The insert shows the tectonic plats promoting the rift.
Fig. 5 The Great Wall of mountains and volcanoes west of the Rift are marked in the blue bracket. The Sahil marked in green, is the sub Saharan line south of the desert. The Great Wall and the Sahil are Africa’s migration barriers.
Fig. 6 Sub Sahil desertification is below the Sahara and is a high risk for drought. The light blue outline defines the Great Migration area. This area is at moderate drought risk.
The illustrated route could be followed in both directions as driven by climate change and the paths of migration of predated species sought after by the apex predators. As the glaciation advanced or retreated these routes would have water which would support grasses, insects, herbivores and carnivores. The Nile is the only north /south river. It flows to the Mediterranean through the Great Rift valley. Following the Valley waterway this leads to the choke points to the Eurasian continents. Following the east west routes of the Congo River, the Niger River or the Zambezi River leads to migration potential but dead ends at the two vast oceans.
Fig. 7 This is a conceptualized path for the bidirectional migration routes shown in red overlying a map of Africa.
We will follow two cat species which are the result of adaptations after the last Glaciation period. Panthera contains the largest number and variety of living members of the cat family. There are five living species: the jaguar, leopard, lion, snow leopard and tiger. It contains the five living species of “big cats” capable of roaring. Cheetahs belong to a completely different biological genus (Acinonyx). They cannot roar, have distinctly different anatomy, including semi-retractable claws for high-speed traction and a unique, lightweight skeleton
Fig. 8 Gross view of lion subspecies
Fig. 9 Gross overview of cheetah subspecies
Continue to follow this amazing story of Earth changing forces. See the combination of struggle, adaptation and survival of life that sweeps across the planet through hundreds of thousands of years. Learn about the unique capabilities and risks to the Cheetah and the Lions. Because we are part of this great drama, you may use this knowledge to anticipate our future.
This section presents a structured account of observations made in the reef system surrounding Roatan, Honduras. This is not unique to this location but the conditions are consistent with other findings in the reef systems of the Gulf. These findings and identifications are based on personal experience and the efforts of amateur naturalists. These observations extend a continuing investigation into coral reef health, previously initiated in the post titled “Death in Paradise.” See past posts. This is presented is made to support my application to the Water School at Florida Gulf Coast University to study for a Master’s in Environmental Sciences. The goal is to learn more about coral reefs, coal polyps, and polyp disease.
These observations are findings revealed by white light flash photography during the day and ultra blue illumination lighting with amber filtration to show fluorescence at night. It was not possible to superimpose photos of identical structures due to instability caused by rough sea conditions.
IMAGES WITH FLUORESCENT LIGHT
Figure 1: Fluorescent Green Goniopora Coral
Photographed using an ultra-blue light source and an amber filter, this image depicts a fluorescent green Goniopora coral, also known as the flowerpot coral. Under white light, these corals appear dull brown, but under blue or UV light, their fluorescent pigments—produced by dinoflagellate algae within the polyp—create a vivid green glow. This species is a Large Polyp Stony (LPS) coral, notable for long, fleshy polyps resembling a bouquet of flowers. The coral may belong to either the Goniopora or Alveopora genus, which can be differentiated by tentacle count—Goniopora polyps have 24 tentacles, while Alveopora have 12.
Figure 1. Photo with ultra blue light source and amber filter on camera
Figure 2: Tubastraea faulkneri (Orange Cup Coral)
This image, also captured with ultra blue lighting and an amber filter, shows a coral likely to be Tubastraea faulkneri, the orange cup coral. Typically orange, this species may display green or yellow variations under specific lighting. Tubastraea faulkneri is a non-reef building LPS coral, often inhabiting cryptic environments such as caves, overhangs, and shipwrecks. Notably, it is a zooxanthellate carnivore, lacking symbiotic algae and feeding by extending its polyps at night to capture plankton. Its distribution spans the Atlantic Ocean and Caribbean Sea with origins in the Indo-Pacific.
Figure 2. Photo with ultra blue light source and amber filter on camera
Figure 3. Montastraea cavernosa (Great Star Coral)
This photograph features a coral with a bright green base and purple-rimmed polyps or tips, possibly a Neon Green Cyphastrea, Montastraea cavernosa (Great Star Coral), Goniopora, or Fimbriaphyllia (Frogspawn/Hammer coral).
Figure 3: Neon Green Cyphastrea or Similar Species
Figure 4.
An image taken with blue light and an amber filter shows a central region of dead coral polyps highlighting loss within the colony.
Figure 4: Central Area of Dead Coral Polyps
Figure 5: Montipora Coral (“Shamrock Monti” or “Rainbow Montipora”)
This photo reveals a Montipora coral, recognized for vibrant green polyps on a purple or blue base under actinic lighting. As an SPS coral, it displays a bumpy, encrusting growth form and is valued by reef keepers for its resilience and fast growth. The coloration varies with lighting conditions, often intensifying under different spectrums.
Figure 5. Photo with ultra blue light source and amber filter on camera
Figures 6–8: Disease Progression in Montipora Coral
Figure 6 shows a Montipora coral under blue light. Figure 7, an enlargement, illustrates zones of normal tissue, dysfunction, and tissue loss, suggesting the possible progression of Stony Coral Tissue Loss Disease (SCTLD). Figure 8 highlights an encrusting Montipora structure glowing green under blue/UV light, with blue/purple areas indicating disease and tissue death.
Figure 6. Photo with ultra blue light source and amber filter on cameraFigure 7. This enlargement of the Figure 6 image shows the possible progress of SCTLD on the surface of the coral reef. Indicated are the various zones of normal, dysfunctional and tissue loss zone.Figure 8. Photo with ultra blue light source and amber filter on camera
Figure 9: Surviving Fluorescent Polyp Coral
This image depicts a fluorescent polyp coral barely surviving amidst lifeless surfaces devoid of reflective polyps.
Figure 9. Photo with ultra blue light source and amber filter on camera
Figure 10: WWC Electric Daisy (Stylocoeniella armata)
This specimen is a small polyp stony (SPS) coral, forming a dense, textured mat and known to compete with other corals upon contact. (often called a “thorn coral”).
Figure 10. Photo with ultra blue light source and amber filter on camera
Figure 11: Maze Brain or Worm Brain Coral
Likely a Platygyra or Favia species, these coral display neon green and purple fluorescence due to specialized proteins. It forms dome-shaped colonies with maze-like channels and can be semi-aggressive, extending sweeper tentacles at night. Nutrition is primarily derived from symbiotic algae.
11. Photo with ultra blue light source and amber filter on camera Figure
Figure 12: Encrusting Montipora or Cyphastrea
This image shows an encrusting coral, possibly Montipora or Cyphastrea, with green and purple fluorescence. The coral spreads as a thick mat, but species identification requires microscopic skeleton examination.
Figure 12. Photo with ultra blue light source and amber filter on camera
imagesWITHWhite light with photoFlash
Figure 13: Mustard Hill Coral or Related Species
Using white light flash, this photo captures a yellow, bumpy stony coral, likely a mustard hill coral (Porites astreoides), star coral (Orbicella spp.), or brain coral. The coral features a massive, uneven surface covered in small polyps. An encrusting goup of organism is growing in the cavity of the stony skeleton devoid of polyps. These corals are native to shallow, warm Caribbean reefs and play a critical role in reef-building.
Figure 13. Photo illuminated by white light flash.
Figure 14: Diseased Brain Coral
This image shows a brain coral suffering from disease with evident demineralization and erosion.
Figure 14. Photo illuminated by white light flash.
This photograph shows Colpophyllia natans, a common and large brain coral in the Caribbean. The coral displays wide, meandering ridges and valleys with contrasting colors. Fine, narrow lines (septa) running from ridges to valleys help distinguish this species. Boulder brain coral forms massive colonies and is a dominant reef-builder in shallow environments. It is currently considered vulnerable due to climate change, acidification, and disease. The central area in the image shows disease-related polyp loss.
This image likely features a Symmetrical Brain Coral, forming a dome-shaped colony with convoluted valleys and rounded ridges. The coral is yellowish-tan with darker areas, lacking the groove found in some related species. Pseudodiploria strigosa is widespread in Caribbean shallow waters, slow-growing, and foundational to reef habitats, supporting symbiotic algae (zooxanthellae) for photosynthesis.
Note the irregular loss of polyp growth on the surface of central and right side of the specimen. This is consistent with the result of spreading SCTL disease. Additionally, the adjacent coral is completely overrun by the opportunistic algae.
Figure 16. Photo illuminated by white light flash
Figure 17: Lettuce Coral (Agaricia spp.) and Codium Macroalgae
The image features a ruffled lettuce coral (Agaricia spp.) (Agaricia agaricites or Agaricia tenuifolia} and green branching macroalgae (Codium). The coral forms undulating plates or branches, often yellow-green or brown.
Substantial polyp loss and algal overgrowth are evident. The accompanying Chlorophyta Codium macroalgae, known as green sea fingers, have a distinctive branching structure absorb nutrients like nitrates and phosphates from the water.
Figure 17. Photo illuminated by white light flash
Figure 18: Field of Broken Coral
White light photography reveals an expanse of broken, lifeless coral, a few healthy finger corals, and one small fish.
Figure 18. Photo illuminated by white light flash.
Figure 19: Pillar Coral Disease Progression
This image of one of the pillar coral species shows a pattern of disease spread from the bottom to the top where the top appears relatively healthy in this daylight exposed photograph. The lower two thirds are bare of polyps. This area has been overrun by algae.
Figure 19. Photo illuminated by white light flash
Figure 20:
This image of a collective variety of stony corals in various states of disease progress. A patch of polyp covered coral is on the lower left. Exposed stone is seen in the central area. The remainder is covered by several opportunistic algae species. The images in the distance are overrun by SCTLD and covered with algae.
The organism shown in Figure 21 is likely a Snakelocks anemone. This finding is new to me. It is an invasive species out of its eastern Atlantic / Mediterranean range. Its tentacles are long and flowing, colored green, grey, or light brown, and tipped with violet or pink. Symbiotic algae embedded in its tissues supply nutrients through photosynthesis. Predatory by nature, it uses stinging cells to immobilize prey, although its sting is mild for humans. There were no observable mutualistic anemone fish. This supports the suggestion that these are indeed invasive.
Figure 21. Photo illuminated by white light flash
Figure 22: Chocolate Brittle Star (Ophiuroidea cinereum)
The organism in this image is likely a brittle star, endemic to the Gulf of Mexico and known as the Chocolate Brittle Star.
Figure 22. Photo illuminated by white light flash.
Figure 23 – 24: Finger Coral (Porites spp.)
This image displays a branching finger coral, common in the Caribbean, with short, blunt, finger-like lobes. Porites typically have thicker branches, while Porites furcata features thinner, rounded tips. Both can appear green, yellow, or greyish, with color and growth form influenced by habitat conditions.
Figure 23. Photo illuminated by white light flash
This enlarged view of Figure 23 depicts relatively healthy coral with no signs of Stony Coral Tissue Loss Disease (SCTLD).
Figure 24 This enlargement image of Figure 23 shows relatively healthy coral without signs of SCTLD
Conclusion:
All stony coral varietals seem to be subject to the same disease. The progress of the disease is unchecked and is advancing. The algae may be flourishing because of increased nutrients in the areas resulting from decomposing polyps and because they are optimizing an echo-niche left vacant by the polyps. The algae are not rebuilding the reefs. The fish population is also in great decline probably secondary to the degradation of the reefs.
Personal Commentary and Reef Health Summary
After thirteen dives across six reef sites in Roatan, Honduras, the overall impression was a declining reef system. Notably absent were turtles, large fish, sharks, lobsters, tunicates, and nudibranchs. The reef, once vibrant, now stretches for miles as broken, gray-brown expanses covered by algae. Invasive species observed included lionfish, a single anemone, Tubastraea faulkneri coral, and two spiny urchins. Only small fragments of some coral species persist, with no Elkhorn, Pillar, or Staghorn forms present and much of the previously widespread fluorescence now largely gone. While some sponges and fans remain, the images presented here document the few surviving patches of live coral polyps amid non-fluorescent, algae-covered stone skeletons.
Plan for remediation:
Problem Statement
The Stony Coral Tissue Loss Disease is relentlessly advancing and destroying the vital surface of the stony reefs. The cause of this disease is not yet discovered. This is a continuing catastrophic event. Work is in progress and includes maping, determining the progress rate and direction of spread. The causality and cure are not yet determined.
If you wish comment please use the form below
If you wish to participate in discussion please use the board.
If you wish to receive notifications of new posts please subscribe
4 responses to “Fluorescent Photography Highlights Coral Health Issues”
Cindy
You examined so many varities of coral. It is very disheartening to learn how badly the disease is treating the reef. If you can determine the primary cause that will be wonderful, and a first step to treatment.
Cindy
There is so much unknown about diseases in the ocean. This one is devistating and the cause is unknown. Hopefully the project that I planned will make some difference.
It is devastating seeing the reefs dying and nearly everything else with them. I stopped scuba diving some years ago and I am happy to have seen beautiful reefs in many parts of the world.
Let’s get serious about the Florida environment. This first posting outlines the three major issues regarding the future of Florida, especially Southwest FL.
The title image is a view of Estero Park Preserve. I added the sign graphic.
Scenarios for the future
Risk/benefits of rewilding
Consequences of species intra- and interdependence
For centuries Florida has been famed for its vibrant and diverse wilderness. It is a living repository of species drawn from the Caribbean, the Gulf, and subtropical America. Yet the past two hundred years have seen this unique ecosystem ravaged. People introduced non-native species, relentlessly homesteaded, and transformed the landscape for agricultural and urban development. The result is a wilderness in crisis. It is fragmented, altered, and teeming with exotic species that out compete or hybridize with the native flora and fauna. This document series outlines a strategic plan for the future of Florida’s wilderness. It is an examination of possible scenarios. It presents the risk/benefit calculus of rewilding. It supports species interdependence. It has a step-by-step outline for ecosystem restoration.
Definition: Rewilding is comprehensive, often large-scale, conservation effort focused on restoring sustainable biodiversity and ecosystem health. (institute of Rewilding)
This is one example of tens of thousands of citrus groves abandoned and overrun by invasive species.
Babcock ranch preserve undeveloped wet prairie
Babcock ranch preserve undeveloped upland wood
Major Scenarios for the Future of Florida’s Wilderness
Florida stands at a crossroad, with three major possible scenarios for the trajectory of its wilderness:
1. Continuance as a Species Repository: For millennia, Florida has served primarily as a bank of species. Rather than an origin point for evolutionary novelties it has been a major exporter of species elsewhere. Rewilding under this scenario would focus on maintaining and nurturing native species. It preserves the region’s role as a living archive of biodiversity.
2. Generator of New Species: The widespread introduction of similar but non-native species—both intentionally has created a dynamic environment. Hybridization and adaptation of ornamental and agricultural plantings will unintentionally transform Florida into a generator of new species. Unpredictable and unintentional ecological outcomes will result.
3. Degraded Ecosystem: If rewilding efforts fail or are mismanaged, Florida will become an ecological cautionary tale. With native species in decline invasive species will become rampant. Ecosystem services like water purification, habitat provision, and storm protection will severely decline.
Risk / Benefit Considerations in Rewilding
The imperative to restore Florida’s wilderness must be balanced by a careful analysis of risks and benefits. Rewilding, while promising, is not without peril.
Genetic Integrity: Simply replacing lost native species with physically similar, but non-identical genotypes can backfire. A non-native genotype may outcompete local species or fail to provide for dependent mutualists, causing cascading ecological harms. Cloning or propagating exact native genotypes minimizes this risk while preserving ecological relationships honed over millennia.
Ecological Compatibility: The introduction of new or “replacement” species may disrupt established mutualisms. They may also create new competitive dynamics while further destabilizing the ecosystem.
Proof of Concept: Any rewilding project must proceed through careful. It demands experimentation, trial phases, and rigorous review of existing literature. These will all be needed to maximize chances of success and minimize unintended consequences.
Intra- and Inter-Dependence of Species
Ecosystems are intricate webs with species depending on one another for food, shelter, pollination, seed dispersal, and countless other functions.
Physical and Genetic Identification: Restoration begins with precise identification of native species, both morphologically and genetically. This enables accurate matching of replacement stock and helps avoid mismatches that could undermine restoration.
Codependent Species: Many native species are mutually dependent. For example the relationship between native bees.; wildflowers or wading birds and wetlands. Successful rewilding requires restoration of these relationships, not just individual species.
Environmental Conditions: Beyond the species themselves, restoration must account for the specific environmental factors. Soil chemistry, water availability, fire regimes, and more allow these relationships to thrive.
These are the topics of the postings to follow
Review of State Key Initiatives
Structured outline for rewilding
Maximizing existing objectives
Marketing the concept for large scale rewilding of Florida
Call to action
SUMMARY
This is not just about legacy. This is your own quality of life; your own property value; your own cost of living. What are you thinking about when you don’t support initiatives, don’t press your representatives and spread invasive species? There are only three choices. 1. Fix it; 2. live with it as is; 3. abandon it and live with the consequences.
Let’s know your thoughts. Leave a reply jn the comment box below or start a thread in our discussion board.
If you wish to receive notifications of new postings enter your email and click on subscribe.
Everglades Ark is traveling again. This year the itinerary includes two weeks in Africa in the middle of our trip to Europe. Africa is a remarkable generator of spectacular species and a reservoir of diverse wildlife. This will be our second visit to the area below the horn of Africa. Kenya and Tanzania both offer excellent wildlife viewing. Three years ago we were in central Kenya to see its high concentration of wildlife, particularly in the Masai Mara. This time we will spend another 7 days in Kenya followed by 7 days in Tanzania. These regions are known for their vastness and remote wilderness areas.
The title picture was created from a photo made during the last trip to the Masai Mara. It is part of a community presentation made here in Bonita Springs FL.
In this area I expect to see a somewhat different variety of bird species and different behaviors. I am really looking forward to this safari and hope to bring back great stories and images. Our 2022 postings from the previous trip to Africa were extremely well received. The new posts of this experience should be ready in the fall. I will do my best to assure that they too are appreciated.
We will travel with National Geographic, G Adventures. Our group of 6 in the vehicle should make a reasonably comfortable seating arrangement. Our winter weather will be relatively cool and mild. Some of the location highlights will include the Great Migration, Ngorongoro crater and the Great Rift Valley.
The safari photo gear will be much the same except for the new Canon R5 body. This camera body will allow for more videography, better image stability, faster image recording and higher resolution. The array of memory cards will fill the demands of the two cameras. I will not use a blue tooth hard drive for image back-up. Every evening I plan to upload the images from the cards of the day directly to the iCloud . To facilitate this I will use the FTP on my iPad. For those interested in photography, here is a NatGeo link to aid in basic photographic experience when you photo/travel.
The highlighted area in the Africa map shows the approximate travel area.
The itinerary includes:
Nairobi, Nakuru lake and park
Naiviasha Lake
Masai Mara plane
Olduvai Gorge and anthropology museum
Serengeti National Park
Ngorongoro national park
For those interested in wildlife photography and stories of Africa follow us for the posts in September!
If you wish to receive notices of future postings please fill in your email and click on subscribe
This posting is a response to the numerous hits made on a previous posting featuring the Non invasive Bauhinia tree. It seems that the interest lies in its reproductive nature. The purpose of this post is to improve the understanding of plant biology through comparative anatomy.
The title image shows the Bauhinia (blakeana ) on the left and the Florida native scarlet rosemallow (Hibiscus coccineus) on the right. I photographed the Bauhinia in the roadway median of our neighborhood. I photographed and display the scarlet rosemallow because it is such a stunning finding in the fresh water marshes of the Corkscrew Nature Preserve in SW Florida. It also shows that it is not a cultivar but it can self propagate without human intervention. Both plants are eye candy that must be appreciated in their out-of-door surroundings. In our community we have domesticated tropical hibiscus which are close relatives to the wild scarlet hibiscus
These two blossoming plants attract loads of attention. The Hong Kong orchid (Bauhinia blakeana ) and the cultivated tropical Hibiscus (Malvaceae) produce wonderful, flamboyant, visually attractive flowers. They are planted throughout our community. Additionally, these blooms have great staying power lasting for many months. Their flowering period stretches anywhere from eight to ten months, from September to June. They have, however, remarkably different reproductive powers. To reveal the secret of these two plants this posting compares the gross and micro anatomy of their two flowers.
Bauhinia blossom with some pettals removed
Hibiscus blossom with no petals removed
Gross and micro dissection reveals the major difference in the reproductive capacity of the these two perfect flowers. Dissection and microscopic examination of the ovaries shows that the hibiscus has ovaries while the bauhinia has no trace of ovules. It is unable to sexually reproduce.
This is a full dissection of the Bauhinia × blakeana blossom. Look at the top left images. You can see that under microscopic examination there are no ovaries within the ovary. This plant is infertile.
This is a full dissection of the Hibiscus blossom. Look at the top left images. You can see that under microscopic examination there are ovules within the ovary. This plant can produce seeds. It is fertile.
The five-petaled blossoms of Bauhinia plants are known as “perfect flowers,” because each individual bloom contains both female and male parts. Some varieties of the Bauhinia flower, such as the widely cultivated Hong Kong Orchid Tree (Bauhinia × blakeana), are known to be sterile. Bauhinia are monoecious, which means “single house”. This designation describes the dual sexual capacity in a single flower. The flowers can self pollinate or fertilize with pollen from another plant. The flowers attract pollinators such as hummingbirds, bees, butterflies, and more. Bauhinia × blakeana‘s sterility is due to its hybridization. Bauhinia blakeana is the result of conjugation of the very similar species Bauhinia purpurea ( Purple Camel’s Foot) and Bauhinia variegata ( Camel’s Foot Tree). Both of these are exotic species according to the Hong Kong Herbarium. The parent plants have partially overlapping flowering periods and geographical habitats, and the same range of bee and butterfly species as pollinators. Interbreeding Bauhinia purpurea and Bauhinia variegata is probable. The resulting triploidy of this plant has probably rendered this varietal sterile. The plants you see today are clones of the same flowers seen by Hongkongers more than a century ago. They are propagated asexually through cultivation of stem cuttings.
The Hibiscus is also considered a perfect flower which actually produces viable seeds. The hibiscus is a genus of flowering plants known for their large, showy flowers, belonging to the mallow family (Malvaceae). Fertilization of these plants is complex. Pollination may fail because of these five prerogatives.
Self-Pollination: Some hibiscus varieties are self-pollinating. This can make it difficult to cross-pollinate them.
Timing: Hibiscus flowers are only receptive to pollen for a short period, usually just a few hours.
Pollen Viability: Hibiscus pollen can lose its viability quickly.
Stigma Receptivity: The stigma needs to be receptive to pollen. The stigma, gateway to the ovarian, might not be receptive at the same time the pollen is viable.
Germination: Seeds take 12 to 24 months to bloom.
The hundreds of species of hibiscus are generated through human intervention of the pollination. Tropical hibiscus are propagated sexually from seeds or asexually from stem cuttings or plant division. In carefully controlled environments and with delicate, patient effort botinists have hybridized the tropical hibiscus to make hundreds of beautiful new varieties. The new plant varieties are propagated from cuttings or division to produced plants which are clones of their parents.
In addition to timing, these four hormonal obstacles must be passed in the carpel for signaling a specific selection of pollen appropriate for germination of ovules in these species.
DISCUSSION of FINDINGS:
This is not a thorough scientific data collection. Three samples of blossoms from each of two trees were collected for a total sample size of six. All of the samples were made on the same day in April, 2020. There were no major local meteorological events for the year preceding this observation. There were no observations of the viability of the observed polled during this observation. Further study should be done to give this a high level of confidence of the conclusions.
SUMMARY:
In Florida the Bauhinia × blakeana and Hibiscus plants thrive and are found in almost all of the cultivated communities and household gardens. They are well tolerated but stable non-native species. Because of their reproductive limitations they are not invasive. We can feast our eyes on this banquet of form and color without fear of damaging the environment.
The purpose of the classical Japanese garden is to provide a place for meditation and veneration. A Shinto shrine is the historically oldest and perhaps archetypical garden. Its form may date back to 500 BCE. It is noted for its rusticity and blending into the local surroundings. It is a place for contemplation and veneration of the native elements and important concepts and significant ancestral figures. These spiritual elements called “Kami” were recognized as important and worthy of respect or veneration. These were not deities for worship but instead were intellectual constructs supporting the Japanese “rules of civility”
This is part 4/5 in a series of postings on my experiences and observations of gardens of Japan. For a complete understanding please visit the other postings. (1)(2) (3)
There are typically 6 elements in the classical Japanese garden. These include a Torii Gate, a bridge, one or more lanterns, rocks, a pond, and trees.
Myojin Torii gate with upward curve
The Torii is a gateway which is placed at the entrance of the shrine. It signifies the transition between the ordinary and the spiritual worlds. Often it is painted carmine red and made of wood. I frequently saw two shapes. Myojin torii are curved upwards at their ends and have a crossbeam that extends past the posts. Shinmei torii have a straight top and a crossbeam that ends at each post. There may be associated symbolic decorative rope or string accents called Shimenawa which along with trees further signify the boundaries of the shrine space.
If you come to a choice, make it.
The bridge symbolizes transition from one state of existence or world to another; from mundane to spiritual, from our sensual mortal reality to perfect immortal paradise. They maybe made of stone or wood and maybe either elaborate constructions or simply a single flat stone. Stepping on a bridge gives us a choice – either we cross it and take time on the bridge, or we turn back. In some gardens, bridges led to a central island called nakajima, which symbolized the Pure Land of Amida Buddha.
Stone lantern with place for a candle.
Stone lanterns originate in Buddhist traditions where the light suggests the enlightenment of Buddha’s teachings through the darkness of ignorance. From a Shinto perspective stone lanterns or yorishiro are made to attract, guide and house kami in the created sacred space. Each item in the construct has special significance. They are regarded as peaceful and tranquil.
Garden rocks selected and arranged for contemplation while sitting.
Rocks are ever so carefully selected, placed and arranged into the shinto garden. They are the residences of the kami. They symbolize the mountains or islands or even powerful figures in the Japanese pantheon. They are especially important in the Zen Buddhist garden. In the Zen garden, rocks stand for Mt Horai, the “Blessed Isles of the Immortals”.
Expansive water feature with bridge in background
Sand representing water in Zen garden
Water in the shinto garden represents purity or purification. Without water in the garden the significance of bridges, rocks and islands would be lost. Ponds and especially flowing water are a key element to all but the Zen gardens. Instead of water in the Zen garden, gravel and stones are carefully placed and raked into patterns resembling rippling water.
Large ancient trees in palace garden
Group of carefully trimmed trees in private garden. Note the variations in color and texture.
Trees are included within and around the periphery of the garden. They are called shinboku, and may be draped with shimenawa rope. The shinto shrine trees are specifically designated as sacred because of their age, size, or connection to a particular kami. Large, old, single or groups of trees are attributed with concepts like immortality or endurance, beauty or mythology. They are the connection between the natural world and the divine.
Perhaps the ideal of the shinto garden, this place is in the wilderness at the base of Mt. Fujii. The Torii arches over the simple stone path. The bridge provides a decisional option to access another route. The native trees surround not only this pleasant lowland but also the entire Mt. Fuji national park. The stones are truely mountainous.
SUMMARY:
The five classical garden types include shinto shrines, buddhist gardens, zen-buddhist gardens, imperial palace grounds, and castle grounds. Images of these can be seen on our previous blog.
Shinto shrines are intended for veneration of kami.
Buddhist monastery: I think of these enclaves as gardens for the mind. They are surrounded garden areas that are mostly devoid of effigies or suggestions of kami. They are intended to provide tranquil respite for peace and tranquility. Buddhism derives from India and became very powerful in Japan. During the Shogunate civil wars the Buddhists fought for independence from the warring parties. During the Edo period Buddhism was considered a threat to the Empire. Its foreign origin and power conflicted with the concept of three principals of Japan; duty to the Emperor, to the Nation of Japan and to the Japanese ancestors. The State no longer supported the monasteries. Attendance dwindled and contributions were insufficient to maintain these mammoth wooden buildings.
Zen/Buddhist gardens: Zen Buddhism arose during the civil wars. The Shoguns combined various portions of the Shinto faith and positions of Buddhism to facilitate their own code of ethics. The esthetic simplicity of the Buddha combined with a strict discipline of the Samurai. This is referred to as the “Shogun way”. Samurai and Daimu modeled their private retreats in the form of shinto shrines.
Imperial palace grounds. The centers of government changed during the more than one thousand years of imperial rule. Several cities were host to the Emperor and these cities hold the remains of the various palaces.
Castle grounds: The castle itself is a military fortification. It was not a residence, instead it was a place for defense. It would be packed with munitions and armaments. These materials were used for offense or as a depot for invasion forces. Surrounding the castle the army would be encamped and the outer rings were the support and suppliers for the troops. The grounds may have extended many square kilometers around the castle. The gardens encircling the castle were for walking, meeting and socializing.
CONCLUSION:
It appears to me that both shinto and buddhism seek enlightenment. They have opposite approaches to achieve this goal. Buddhism puts faith in self inspection, shinto puts faith in kami. Both approaches have value.
REFERENCES:
Japanese Gardens Revealed and Explained, Chard R., Zenibo Marketing, 2013
Japanese Stone Gardens, Mansfield S., Tuttle Publishing, 2009
Marie Gorman, editor-in-chief and publisher of the Bay Watch News, accepted a submission for publication as a feature article written about Stunning Japanese Gardens for volume 7 number 5 April 2025. I previously posted much about this on this site and gave a Power Point Presentation to the Bonita Bay Community Association.
Much to my surprise she accepted two additional photos from my submission for the cover contest finalists. An even greater surprise for me was to see one of them on the cover of this recent issue. The feature image of this blog is a copy of that printed cover page.
Tommye Flemming, a senior contributing editor for the Bay Watch News also asked to interview me for a bio feature of residents in the community. We had a fun conversational experiencing. She was terribly flattering in her biographic sketch and also submitted additional photos from our travel experiences. This too was published in the same issue !
After the Bay Watch News was published, Marie said that she had an overwhelming positive response. I’m so pleased that these images and stories have brought a little happiness to so many people. See the full issue and enjoy the other submissions at this URL. Bay Watch News
Thanks Marie ! You made my day too.
If you wish to receive notification of future postings please enter your email and click on subscribe.
Feel free to use the coments block or go to the discussion board on this site.
The spring series of three lectures was completed with good attendance. Thanks to all who attended and provided excellent feedback for future improvements. Discussions varied from thoughts of amazement in diversity of the ecosystems and colorful beauty of the plants and insects. For those who attended and those who expressed regrets, thanks for your consideration. For those unable to attend, see you next time! We had 23 attendees with sufficient room for 30. Watch for notification for next season in the Bonita Bay Community seasonal program bulletin.
On our blog site we will continue with our discussion of Japanese gardens compared to a Florida garden made in the Japanese traditional shinto style.
Watch for the feature article on Japanese Gardens in the Bay Watch News.
If you wish to engage in further discussions, please feel free to use the discussion board.
If you wish to make a comment, post it below
If you wish to be notified of future publications please enter your email and click on Subscribe.



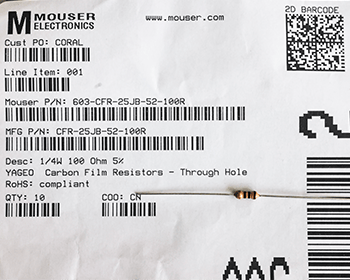








4 responses to “Fluorescent Photography Highlights Coral Health Issues”
You examined so many varities of coral. It is very disheartening to learn how badly the disease is treating the reef. If you can determine the primary cause that will be wonderful, and a first step to treatment.
Cindy
There is so much unknown about diseases in the ocean. This one is devistating and the cause is unknown. Hopefully the project that I planned will make some difference.
It is devastating seeing the reefs dying and nearly everything else with them. I stopped scuba diving some years ago and I am happy to have seen beautiful reefs in many parts of the world.
Yes. Caribbean diving was my first salt water experience now I am reluctant to return. I am so anxious to see some reversal of marine life there.